Health
Making iGen's Mental Health Issues Disappear
Statistical (and rhetorical) abracadabra
Posted August 31, 2017
How big does a difference need to be to matter? This is a key debate across several areas in psychology, including cultural psychology, social psychology, and the study of sex differences (see David P Schmitt’s thorough piece on sex differences, whose title I have adapted, here).
After my iGen book excerpt on the troubling mental health trends among teens and their possible connection to smartphones was published in the Atlantic, I heard from many therapists, parents, and teachers who have observed firsthand how smartphones have affected teens. Others published responses to the piece discussing these issues, using a number of techniques to minimize the generational differences.
First, Alexandra Samuel posted a colorful graph of the happiness of high and low social media users among 12th graders in 2015 in the large Monitoring the Future survey, finding little difference. In the analyses for my book, iGen, I instead included the data from all years when the social media hours question was asked (2013, 2014, and 2015) and from all three grades (8th, 10th, and 12th graders).
Samuel picked the year and the age group with the lowest correlation between social media use and happiness. The link is larger for 8th and 10th graders, and larger when all three years are included for 12th graders. Here’s Figure 3.6 from iGen:
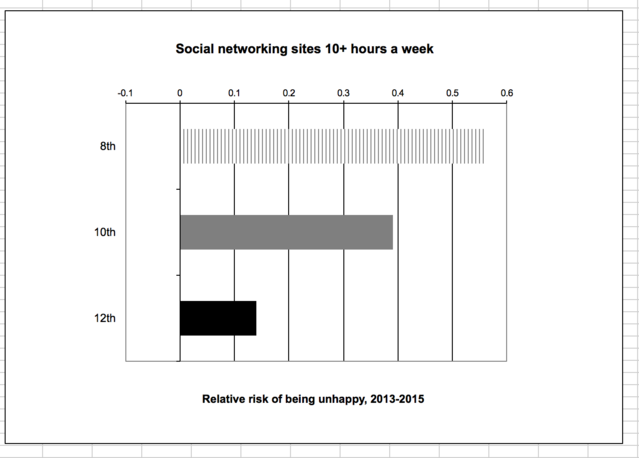
That’s why it was surprising and even a little funny when Elizabeth Nolan Brown, writing on Buzzfeed, claimed I brought “up a study suggesting more unhappiness among eighth graders who are heavy social media users, but doesn’t mention that same study found no effect for 12th graders.” The “study” she’s referring to is this one -- from my own book. And when all of the data are included, there is in fact a significant correlation between happiness and hours spent on social media among 12th graders.
Samuel also showed a graph of 12th graders’ happiness over time – though because she used percentages instead of means, it’s difficult to discern the trend lines. And once again, she highlights the trait and the age group with the smallest change. Here’s happiness over time for 8th, 10th, and 12th graders:
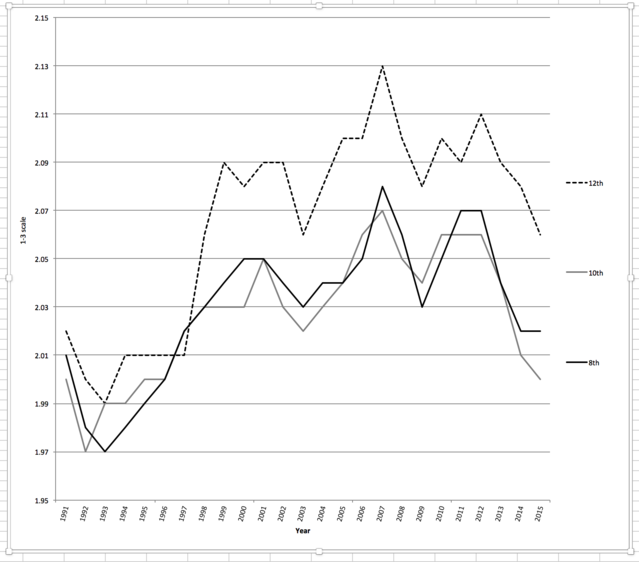
Samuel also wonders how I could have found, just a few years ago, that teen happiness was going up. As this graph shows, the answer to that question is straightforward: Teen happiness went up, and then it went down.
Although noticeable, the decline in happiness is relatively small, and it’s measured with just one item. To get a better look at teens’ well-being, it helps to look at many different indicators. For example, here’s the percentage who score a 3 out of 5 on a 6-item measure of depression, by sex:
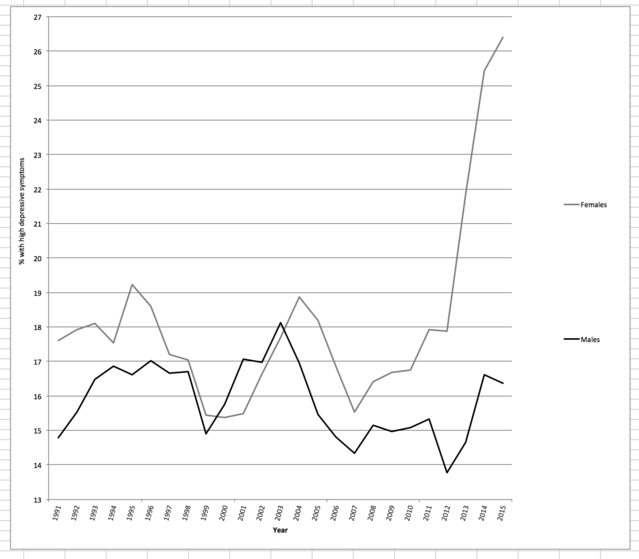
The shift among girls is not a small change -- it's a 50% increase. The increase in the suicide rate is also large -- according to the CDC, it has tripled among girls and doubled among boys ages 10 to 14 and increased by 50% among 15- to 19-year-olds. In addition, the NS-DUH national screening study found a 50% increase in clinical-level depression among 12- to 17-year-olds in just 4 years (from 2011 to 2015). Another study found that the number of children and teens admitted to hospitals for suicidal thoughts or self-harm doubled over the last 10 years. In other words, the most serious mental health issues showed the largest increases.
But what is causing these troubling trends? They lag the beginning of the Great Recession by about 5 years, so cyclical economic factors seem unlikely. The largest change in teens' lives between 2011 and 2015 was the extremely rapid adoption of the smartphone. And sure enough, teens who spend more time on screens are more likely to have mental health issues. That suggests the advent of the smartphone might be one of the causes behind deteriorating mental health.
At Slate, Lisa Guernsey brought up correlation vs. causation: “we need to better understand what is causing what. Are social media and the convenience of our mobile devices causing young people to be more depressed? Or, could it be the other way around: They already are more depressed, and they are turning to their phones for solace?” However, three studies have virtually ruled out this latter possibility (discussed in more detail here). Two studies following the same people over time found that more social media use led to unhappiness, but unhappiness did not lead to more social media use. A third study was a true experiment (which can determine causation); it randomly assigned adults to give up Facebook for a week, or not. Those who gave up Facebook ended the week happier, less lonely, and less depressed. All three of these studies suggest that using social media causes unhappiness/depression, rather than lower well-being causing unhappiness.
Depression causing social media use also can’t explain why depression would increase so suddenly after 2011-12. If the increase in depression occurred first, some other, unknown factor would have to cause depression to rise so sharply, which would then lead to more smartphone and social media use. It seems much more likely that smartphone and social media use went up, and the increase in symptoms of depression followed.
Guernsey writes that she sees only two solutions: “There’s the laissez faire route: ‘Don’t worry about it, kids are kids, at least they’re not doing drugs, let me get back to my own phone.’ Or there’s the impossible one: Wrench those phones out of your teens’ hands and tell them to go straight back to 1985, right now, no backtalk.”
No one needs to go back to 1985, because there’s a third solution: Moderate use. As others have also found, smartphone or internet use of up to an hour or two a day is not linked with mental health issues or unhappiness. (Here’s Figure 3.10 from iGen; this also addresses Samuel's point about amount of use, but with data from all ages and all years). It’s two hours a day and beyond that that’s the issue.
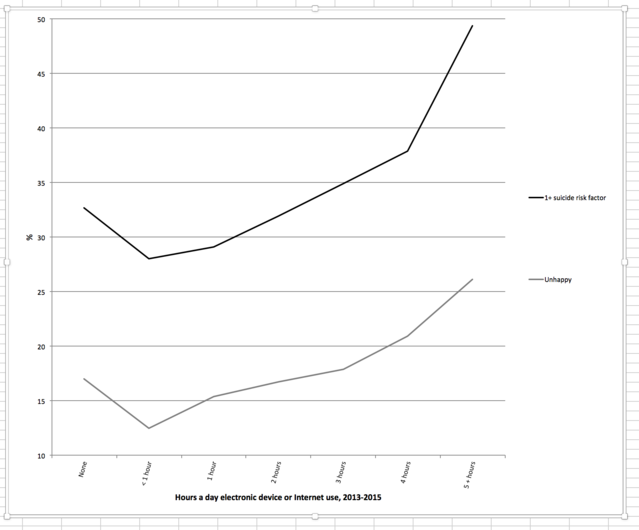
The same is true for social media -- it's two hours a day of use and beyond where unhappiness really starts to increase. So there's no need to take the phone away -- instead, put limits on the amount of time teens spend online or on social media (there is an app for that -- several, actually, including Kidslox and Teen Safe).
Then there’s Brown’s piece on Buzzfeed. I’m not going to cover here what she says about my previous work on Millennials, as everything she mentions has been rebutted so many times before, and so thoroughly, most of it more than 7 years ago. Of course, she doesn’t mention a single one of those rebuttal responses. (She also pulls some classic underhanded tricks, like writing that the Chronicle of Higher Education “declared” something, when the article was actually written by a Texas A&M International University professor).
Once you cut through the bluster, here are Brown’s main points about iGen:
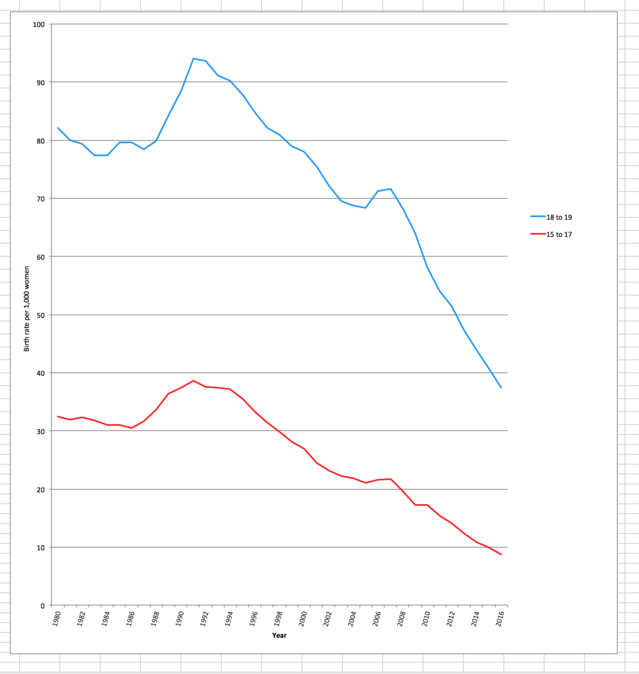
• She writes that I did not include “counterevidence [that] includes ample data showing that Gen Z, like millennials before them, have far lower rates of smoking, unprotected sex, car accidents, alcohol use, and teen pregnancies … Twenge ignores all of this.” In fact, my book excerpt in the Atlantic mentions – and in the case of teen sex, even graphs – these trends.
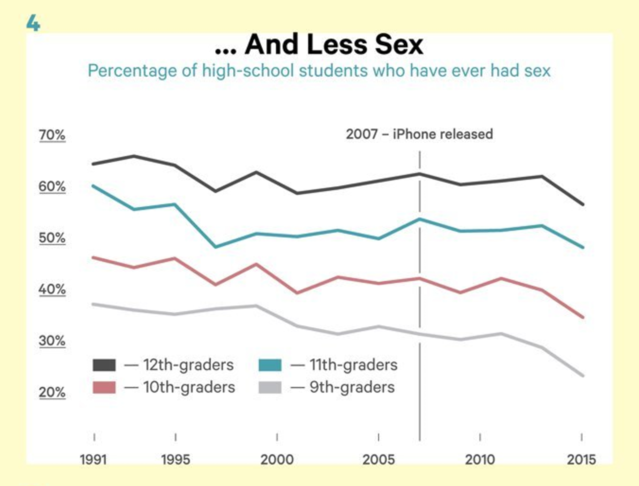
I also extensively document these trends in Chapters 1 and 6 of iGen -- there's a whole section on declining alcohol use and two graphs on the decline in car accidents. Teen sex is the third graph in the book; teen pregnancy is the fourth. This is not “counterevidence” – it’s data that is a central part of my book. The Atlantic article even highlights it in its tagline: “post-Millennials are safer, physically, than adolescents have ever been.” This is one of the main themes of my book: iGen is physically safer but more mentally vulnerable.
Here, Brown seems to assume that because I document iGen’s struggles with mental health, I must think that all of the generational trends are bad – and that the generation is all bad. Not at all: some of the trends are good, some are not, and some are neutral.
She also seems to think that I automatically believe all of the trends – even those most people would see as good or neutral -- are bad, to fit some pre-determined negative thesis I don’t actually have. For example, she asks, “Why should we lament, as Twenge does, a 50% drop since the 1970s in eighth graders working for pay?” But I don’t lament that. Instead, I note that seeing the trends as good or bad misses the big picture, which is that teens are taking longer to engage in both the pleasures and responsibilities of adulthood. Some of these are good (fewer teens getting pregnant), but most are neither good or bad (fewer driving and working). Sara Rose Cavanaugh makes the same assumption, saying I “cast aside” the good trends. Not even close: They are in Chapter 1 of iGen – front and center, exactly the opposite of being cast aside.
Brown and Cavanaugh both seem to be unable to comprehend the simple idea that a generation can demonstrate both positive and negative trends. They believe I’m saying it’s all bad (which I’m not), so they try to make the case that it’s all good (which it’s not).
Their argument seems to be “iGen is less likely to smoke and get into car accidents, so they can’t possibly be depressed.” That’s like saying “Toddlers have lovely chubby cheeks and say cute things, so they can’t possibly have temper tantrums.” The behaviors aren’t related – it’s just that the first set are “good” and the next are “bad.” Both “good” and “bad” things can be true at the same time.
• Brown repeats Cavanaugh’s claim that I ignored studies that did not show a link between screen use and well-being. As noted in more detail here, the Atlantic article was a book excerpt, so not surprisingly it featured the analyses from the book, based on the large national surveys of teens. Those showed negative correlations between screen time and well-being. In addition, a recent meta-analysis of 67 studies found an average negative correlation as well. So this idea doesn’t hold up.
• She then notes, “Teens today are going out unsupervised less. There are reasons for this other than teens being ruined shells of human beings — such as increased participation in extracurriculars and organized activities — that could account for this.” Except there has not been any increase in participation in extracurricular activities. As the Atlantic article noted, “The time that [high school] seniors spend on activities such as student clubs and sports and exercise has changed little in recent years.” The book devotes 3 pages in the main text (including 1 graph) and 2 graphs in the appendices to the data on homework time (down or unchanged from the 1980s/1990s to the 2010s) and extracurricular activity time (unchanged). Guernsey also hypothesizes that time on extracurriculars is to blame, but it can't be, because it hasn't changed.
• Brown concludes, “The kids, by almost all measures, are more than alright.”
I wish that were true. But when the CDC tells us that the suicide rate for teen girls is the highest it's been since they started tracking it, and government-funded studies document a 50% rise in clinical-level depression, it is sadly not true. To come back to the theme of the book: iGen is physically safer than ever. This is wonderful. But that’s occurred at the same time that more are suffering from anxiety, depression, and stress, and more are committing suicide.
Dismissing these real issues, or trying to pretend that they are small differences, is not going to make them go away. Instead, we need to find out why so many teens are suffering so we can help them. The downside of assuming screens are one of the causes of these serious issues is small: Parents limit teens' phone or social media use to 2 hours a day or less. That seems to have few downsides. However, the consequences of brushing aside these considerable increases in teen depression and suicide rates is much more serious.
References
Twenge, J. M. (2017). iGen: Why Today’s Super-Connected Kids Are Growing Up Less Rebellious, More Tolerant, Less Happy – and Completely Unprepared for Adulthood. New York: Atria Books.
Shakya, H. B., & Christakis, N. A. (2017). Association of Facebook use with compromised well-being: A longitudinal study. American Journal of Epidemiology.
Mojtabai, R., Olfson, M., & Han, B. (2016). National trends in the prevalence and treatment of depression in adolescents and young adults. Pediatrics, 138(6).


