


Abstract
Do the media cover men and women politicians and candidates differently? This article performs a systematic analysis of 90 studies covering over 25,000 politicians in over 750,000 media stories, and presents the accumulated knowledge in a comprehensive theoretical framework. The paper shows that there is a gender bias in the amount of coverage of politicians in proportional electoral systems, where women politicians lag behind men in media attention, but that, surprisingly, this gender bias is absent in majoritarian electoral systems. In addition, we systematically review gender differences in the content of media reports on political candidates, such as differences in attention to private life and family, viability and horse-race coverage, issue coverage, and gender stereotypes. Overall, women politicians receive more attention to their appearance and personal life, more negative viability coverage, and, to some extent, stereotypical issue and trait coverage. We conclude by pointing out promising avenues for future research.
Are women politicians disadvantaged in their media coverage?1 The seminal work of Kahn (Kahn & Goldenberg, 1991; Kahn, 1994) resulted in the emergence of a subfield directed at gender differences in the media coverage of politicians.2 Research in this field focusses on the question of whether women politicians receive different media coverage than their male colleagues, both in terms of the quantity (are women politicians less visible in news coverage?) and the quality (are women politicians covered differently than men politicians in news coverage?) of the coverage. Yet, despite the scholarly interest into these topics, we lack a clear answer to the question of whether media reporting is biased toward women politicians. In this paper, we provide a systematic overview of research on gender differences in the coverage of politicians, using 86 studies in 66 publications and covering over 3,500 women politicians in over 750,000 coded media stories.
Gender bias in the amount and type of media coverage politicians receive is an important topic, as present-day politics is strongly mediatized and voters rely almost exclusively on the media as their source of political information. Disadvantageous reporting by the media can hurt the electoral chances of women candidates and threaten the political longevity of sitting women politicians. Aside from affecting the career prospects of women in politics and, as such, directly contributing to the underrepresentation of women in politics, the media images of men and women politicians in the media are likely to strengthen the association people have of politics as a masculine realm. This, in turn, can depress the political ambitions of young women and discourage political elites from selecting women, leading to continued underrepresentation of women in the future.
Gaps in our current knowledge
Despite much valuable research into gender-differentiated coverage, there are three inadequacies in our knowledge. First, we do not know the overall or average outcome of the research in the field, resulting in three conflicting narratives. One, there are authors who summarize the state of the field as showing that women politicians receive less media attention than their male counterparts (e.g., Ross, Evans, Harrison, Shears, & Wadia, 2013; Verge & Pastor, 2018; see Supporting Information Appendix A for details). Two, there are those who stress contradictory findings regarding gender and the visibility of politicians, with both men and women sometimes having the advantage (e.g., Brooks, 2013; Wagner, Trimble, Sampert, & Gerrits, 2017). Three, there are scholars that posit a trend through time, in which women were disadvantaged a couple of decades ago but are now on an equal footing with men, perhaps due to the normalization of women in politics (e.g., Fernandez-Garcia, 2016; Ward, 2016). Besides being contradictory, these three stories also point to radically different directions for future research. The second narrative, for example, of mixed findings, leads to the recommendation that the conditionality of bias be examined, while the third would suggest that the topic of gender differences in visibility in the news is no longer a relevant object of study. To know the overall outcome, and to know what to study next, we need a more systematic and more comprehensive approach.
Second, we have only limited insight into the nature of any gender bias in the media coverage of politicians. Studies tend to compare various aspects of media coverage per article, usually finding differences in the coverage of men and women politicians in at least one, but not all, of the studied aspects. Because of this, individual studies usually convey the message that there is a media bias towards women politicians, but this can refer to completely different types of coverage. For example, the studies of Miller, Peake, and Boulton (2010) and Robertson et al. (2002) come to similar conclusions; namely, that there is progress towards more equitable coverage, while some indicators of bias persist. Yet, where they find bias and where they find equality differs in important ways: the former study finds that men politicians receive significantly more positive media coverage, while the latter finds that women get significantly more positively toned reporting. So, to know what kind of bias there is, if there is any, we need an overview that compares all the studies there are per each aspect of the media coverage they consider.
Third, we know very little of the conditions that foster or hinder gender-equal media coverage. Due to the labor-intensiveness of data collection and coding involved in content analysis, most studies cover a single country. However, there are a number of contextual factors that are likely to influence the relative press treatment of men and women politicians; for instance, political institutions, societal gender norms, and levels of female representation. Due to the lack of comparative work, the impact of these contextual moderators remains largely untested. Furthermore, the majority of the extant work on this topic is conducted in the United States, so in a presidential system with first-past-the-post elections and two effective parties. Less work is done in parliamentary and, in particular, multi-party systems with high numbers of parties. By systematically and comprehensively comparing the research conducted in different contexts, we can shed some light on these moderating factors.
Theoretical foundations for different types of bias
It is not surprising that numerous studies have compared coverage of men and women politicians, seeing how important appearing in the media is for political actors. Political communication research shows that the visibility of political parties or candidates influences voting behavior: as there is a higher awareness of a party/politician among voters, the party/candidate is deemed more viable by the electorate. This way, the higher visibility of a party and candidate, on average, leads to increases in vote intentions for that party/candidate (Aaldering, van der Meer, & Van der Brug, 2018; Kiousis & McCombs, 2004). Electorally, not only the visibility of the politicians in the media is important, but also the way they are discussed. Research, for instance, shows that the tone of the coverage (e.g., McCombs, Llamas, Lopez-Escobar, & Rey, 1997; Soroka, Bodet, Young, & Andrew, 2009), viability coverage (Schmitt-Beck, 1996; Van der Meer, Hakhverdian, & Aaldering, 2016), and trait coverage influence voters in their electoral choices (e.g., Aaldering et al., 2018; McCombs et al., 1997). Moreover, the gender-differentiated content of coverage can serve to reinforce already existing stereotypes and the status of women in politics as “other.”
Why would there be a difference in the media reporting on men and women politicians? Our focus in this paper is on gender bias in political news coverage; that is, whether women politicians receive different coverage in the media due to their gender. This means differential treatment and, thus, does not include differences in coverage arising from, for example, different political positions of men and women. Based on the literature, we distinguish three main mechanisms that could lead newsmakers to pay different amounts of attention to men and women politicians: (1) the news value of rarity; (2) networks; and (3) stereotypes. In addition, the last mechanism, stereotypes, can also lead to differences in the type of coverage.
First, news values are the criteria journalists use to determine what to cover (Galtung & Ruge, 1965; Harcup & O'neill, 2001). In her pioneering work, Kahn (Kahn, 1994, p. 155; Kahn, 1996; Kahn & Goldenberg, 1991, p. 184) suggested that because women in politics in the United States at that time were still relatively rare, they fit the news value of novelty and could, therefore, be considered more newsworthy and granted more media attention. The results proved otherwise, as women running for the US Senate actually received less media coverage in these data. Research since then has often motivated the choice to study the amount of coverage on empirical grounds rather than theoretical grounds, citing Kahn’s findings as a reason to expect lower attention for women.
Second, gendered access to networks could be a mechanism that drives gender differences in news visibility (e.g., Hooghe, Jacobs, & Claes, 2015, p. 409; Ross, Evans, Harrison, Shears, & Wadia, 2013, p. 12; Vos, 2013, p. 405). Political journalism is a majority-male profession in most countries, and journalists maintain fixed contact lists, as well as socialize informally with politicians during and outside office hours (see Aalberg & Strömbäck, 2011). If journalists have a preference for same-gender (informal) contacts, this could lead the male majority of journalists to reach out more easily to a male politician as a source for an article, resulting in men politicians being more visible in the news (see also Sreberny-Mohammadi & Ross, 1996).
Third, men politicians could receive more media attention as a result of stereotypes. Stereotypes imply that identical characteristics are assigned to all members of a group, irrespective of the differences in characteristics within the group (e.g., Aronson, 2004). They can be descriptive, for example, concerning what men and women are like, as well as prescriptive, dictating what they should be like (Caleo & Heilman, 2013, p. 144). In general, men are believed to possess agentic qualities, such as being aggressive, dominant, ambitious, independent, decisive, and self-confident, while women are thought to embody communal qualities, such as being affectionate, emotional, friendly, helpful, warm, and nurturant (Eagly & Karau, 2002, p. 574; Prentice & Carranza, 2002). Women are stereotypically associated with private life and men with public life (O’Neill, Savigny, & Cann, 2016), and political leadership is associated with masculinity (Koenig, Eagly, Mitchell, & Ristikari, 2011). Because of this masculine connotation of leadership, and because political functions are seen as requiring agentic qualities, journalists can perceive the candidacies of men as more viable than those of women. Since viable candidates are deemed more important to cover due to the news value of power (Bennett, 1990), this could lead journalists to pay more attention to men contenders than to their women counterparts under otherwise similar circumstances.
Besides leading to a lower amount of coverage, gender stereotypes can also give rise to differences in the type of coverage. First, as indicated, stereotypes can work prescriptively, specifying how group member should behave. According to Role Congruity Theory, a mismatch between the perceived characteristics of a social group and the requirements of a social role, such as leadership qualities, lowers evaluations of group members in that role (Eagly & Karau, 2002). In this case, the perceived characteristics of women—that is, the descriptive stereotype of women—are at odds with the requirements of political leadership, via the prescriptive leadership stereotype. Alternatively, the descriptive stereotype of leadership conflicts with the prescriptive stereotype of a woman. The consequence is that women leaders inevitably fail on some standard, because they either violate the stereotype of a leader or that of a woman. This can lead to negative evaluations and reporting by journalists if they (consciously or not) adhere to the prescriptive stereotypes. The resulting expectation is that women politicians are covered with a more negative tone than men. Another possible result of the incongruence is that non-stereotypical behavior is more conspicuous and exaggerated by observers (Eagly, Makhijani, & Klonsky, 1992), while the news value of unexpectedness also pushes journalists to pay extra attention. This has led researchers to hypothesize an overreporting of aggressive or combative behavior on the part of women politicians by journalists (Gidengil & Everitt, 1999,, 2003a, 2003b). The media’s convention to frame politics in masculine and combative terms, such as by using war and sports metaphors, could further exacerbate the effect, according to the “gendered mediation” thesis (Gidengil & Everitt, 1999, 2003a; Sreberny-Mohammadi & Ross, 1996). Additionally, because counter-stereotypical behavior is unexpected, it could be subject to more journalistic interpretation, as opposed to mere description (Gidengil & Everitt, 2000, 2003b).
Second, as the descriptive masculine stereotype of leadership can prompt newsmakers to see women candidates as less viable, they might report more on the viability of women candidates; by focusing more strongly on the question of whether a woman candidate can stay in the race and what her chances are of winning the elections (horse race coverage), they might discuss her professional background and credentials more and describe her viability more negatively. In addition, journalists might also provide more opportunity for candidates to speak to their electorate directly if they are perceived as more viable and, therefore, quote men politicians more directly (rather than paraphrasing them). This has resulted in the expectation that women politicians receive more viability or horse-race coverage, more coverage on their professional backgrounds, lower viability assessments, and fewer direct quotes in the media.
Third, the fact that women are stereotypically dissociated from public life and politics leads to a host of expectations regarding personal coverage. The association of women with private life, physical beauty, and nurturing, supporting roles can find its reflection in coverage focusing more on the personal background, physical appearance, marital status, and children (or lack thereof) of women politicians. Therefore, researchers have expected that women politicians receive more coverage on their personality traits, appearance, and family life. Also, the actual relative scarcity of women in politics, as compared to men, as well as the stereotypical dissociation between women and politics, can make the fact that a politician is a woman more salient to a journalist. The result can be that journalists explicitly mention the gender of the politician more if she is a woman. Furthermore, researchers have hypothesized that the attention to these trivial matters goes at the expense of substantive coverage and, therefore, that women get less issue coverage.
Fourth and finally, media coverage can also directly reflect the content of existing gender stereotypes. If a stereotype is activated and applied to a politician in the mind of journalists (see Bauer, 2015), descriptions of that politician will likely be more in line with the stereotype. Women and men are stereotypically associated with certain character traits, with women associated with traits such as being sensitive, honest, passive, gentle, and compassionate and men associated with traits such as being objective, competitive, strong, tough, intelligent, and ambitious. It has been expected, therefore, that newsmakers use the “feminine” traits more often to describe women politicians, while “male” traits are applied to men politicians. The stereotype not only includes traits, but also certain competencies (Huddy & Terkildsen, 1993). Women are thought to be better at dealing with “compassion issues,” such as poverty, education, health care, and the environment, as well as issues thought to be directly related to interests of women, such as gender quotas, violence against women, and abortion, while men are thought to excel at “tough” issues, such as and foreign policy. Political reporting could, therefore, be in line with these issue stereotypes, reporting on men with “masculine issues” and on women with “feminine issues.” And since leadership is part of the masculine stereotype, women politicians have been expected to receive less coverage in terms of their leadership traits.
Moderators
Since most research considers a single context, we know very little of the conditions under which gender bias in reporting is stronger. Still, some conditioning factors have been hypothesized. Because more powerful political offices are more strongly linked to the masculine leadership stereotype and because of the issues relevant for certain offices, researchers have expected gender gaps in coverage to be larger in higher-level offices rather than at local levels (e.g., Atkeson & Krebs, 2008) and larger for executive functions (e.g., Dunaway, Lawrence, Rose, & Weber, 2013). In addition, political institutions have been hypothesized to matter; in more personalized systems, the individual characteristics of the candidate are thought to affect coverage more (e.g., Kittilson & Fridkin, 2008). Thus, the gender of the candidate would have a larger impact on coverage in plurality electoral systems than in proportional systems. In a similar vein, gender stereotypes may play a larger role in coverage during primaries than during general election campaigns, since the absence of party differences and, often, of large ideological differences also leads to an increased importance of personal characteristics (Hayes & Lawless, 2015). Further, it might also matter whether campaigns or routine political times are examined, as journalistic gender bias might be larger during routine politics, when journalists are less focused on balanced reporting (Aaldering & Van Der Pas, 2018). Finally, if gendered coverage is spurred by the news value of rarity, gender differences in news attention should diminish over time and with higher levels of female representation (Fernandez-Garcia, 2016, p. 143).
As a recap, Table 1 presents all the above-mentioned expectations in terms of gender bias in the media coverage of politicians.
Expected Gender Bias in Media Coverage of Politicians
| Aspect of coverage | Expectation |
|---|---|
| Visibility | Men more |
| Visibility difference | Larger in higher-level political offices |
| Larger in executive functions | |
| Larger in plurality electoral systems | |
| Larger during primaries | |
| Larger outside election campaigns | |
| Larger when further back in time | |
| Larger if female descriptive representation in low | |
| Negative tone | Women more |
| Combative behavior overreported | Women more |
| Interpretative reporting | Women more |
| Viability coverage | Women more |
| Background coverage | Women more |
| Viability assessments | Women more |
| Direct quotes | Men more |
| Personality trait coverage | Women more |
| Appearance coverage | Women more |
| Family life | Women more |
| Mention of gender | Women more |
| Policy issue coverage | Men more |
| “Masculine” trait coverage | Men more |
| “Feminine” trait coverage | Women more |
| “Masculine” issue coverage | Men more |
| “Feminine” issue coverage | Women more |
| Leadership trait coverage | Men more |
Control variables
In order to distinguish journalistic bias from mere differences in reporting that are not due to gender, the political actors under scrutiny need to be comparable on everything but gender, either by design or through statistical controls. Newsworthiness increases with perceived viability and power (Bennett, 1990), so ideally studies should control for positions of power, prior positions, experience, party size, and indicators of viability, such as position in the polls and fundraising. In addition, connections with journalists tend to improve over time and with effort, so the length of time active in politics and the intensity of media-seeking behavior should be held constant. Furthermore, the content of the politicians’ own communication should ideally be controlled for, such as attention in the candidate’s campaign to personal life, appearance, and masculine and feminine issues and traits.
Method for selecting publications
The following criteria were used to select studies:
1) The research must focus on the media coverage of politicians. This excludes research on the media coverage of other professions (e.g., journalists, athletes) or men and women in general (i.e., non-politicians).
2) The method must be content analysis; that is, the research must systematically study the media coverage of politicians in terms of characteristics that were formulated in advance.
3) The research should make a comparison between the media coverage of men and women. This excludes research that only looks at coverage of women.
4) The research should focus on traditional media coverage; that is, newspaper and/or television coverage, and not social media. This criterion was adopted for comparability and feasibility.
5) The study must be published in English.
6) The research should be published in an academic journal or book or presented at an academic conference. We include conference papers in our analyses to lessen the effect of publication bias.
The search was conducted via the Preferred Reporting Items for Systematic Reviews and Meta-Analyses (PRISMA) procedure (Moher, Liberati, Tetzlaff, Altman, & The PRISMA Group, 2009), as summarized in Figure 1. A broad search string to select scholarly research on gender bias in media coverage of politicians was formulated, in which the following aspects were included: content analysis, media coverage, gender, and politician.3 All results from Scopus and Web of Science and the first 300 results from Google Scholar were downloaded. This was supplemented by additional sources, such as tips from other scholars, review articles, the references of included studies, and searches with alternations of our search string. The resulting research was screened for the relevance of the title and, if necessary, abstract, after which the potentially relevant research was read and evaluated by our inclusion criteria. In total, this led to a list of 75 research publications that fulfilled all selection criteria and were coded and included in this paper.
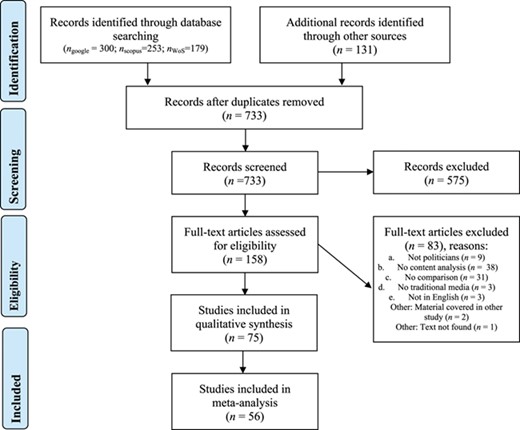
PRISMA flow diagram of study selection process. PRISMA = preferred reporting items for systematic reviews and meta-analyses. Note: Ngoogle is N from Google Scholar, Nscopus is N from Scopus, NWoS is N from Web of Science. Based on 2009 PRISMA flow diagram (Moher et al., 2009).
Method of coding
The selection of 75 academic publications were coded on a number of features. If publications included separate samples and results for different types of politician or elections, each sample was considered a separate case (e.g., Jalalzai [2006], studying both senators and governors). Likewise, separate samples for TV and newspaper coverage, with separately reported results, were treated as distinct cases. Because of this, the 75 publications that were coded resulted in 90 cases in our data set. We coded the basic information of the study: title, author(s), journal or book it was published in, year of publication, number of citations, country or countries included in the study, time frame of the study, whether the study concerns campaign periods, the level of office of the politicians that were studied, the type of election that was studied, the electoral system in which the politicians operate, the disproportionality and the number of parties and seats in that system, the percentage of female representation at the national legislative level, the medium that was studied (newspapers and/or television broadcasts), and whether the study performed a manual or automated content analysis. Then, the characteristics of the analyses were coded, including the type of unit of analysis, the number of observations, and, in the case of visibility, the control variables used. The full codebook and coded data set can be found in the Supporting Information.
Of the 90 study cases, 44 are in the US, 16 in Canada, 23 in Europe, and only two from non–English speaking, non-European countries (Chile and Venezuela). Out of the 90 studies included in our data set, 73 focused solely on electoral campaign periods, 10 focused on routine time alone, and 7 studied both campaign periods and times of routine politics.
Finally, we focused on the results of the study and coded whether (statistically significant) gender differences were found for politicians’ visibility, horse-race and viability coverage, personal coverage, issue coverage, and trait coverage. In addition, we constructed a numerical measure for the difference in visibility of women and men politicians in the study. First, from the reported amount of media attention per man and woman politician, we calculated the proportion of visibility for women (|${P}_f$|) by dividing the reported female visibility value by the total (male + female) visibility value. Using this proportion, we calculated the meta-analysis effect size indicator, |$d^{\prime }$| (Rosenthal, 1984; see also Schmidt & Hunter, 2014).4 The indicator, |$d^{\prime }$|, is simply the difference in visibility proportions of men and women, so |${d}^{\prime }={P}_f-\left(1-{P}_f\right),$| given that |${P}_m=1-{P}_f$|. Some studies reported visibility results as simple means (i.e., zero-order effects), while other studies relied on various types of regression analyses with control variables. In the latter case, we used predicted visibility scores for men and women to calculate d’ in the steps described above, and additionally coded which control variables were used. Of the 70 studies reporting visibility, 52 use no statistical controls, 8 report only regression models, and 10 report both. The d’ scores observed in our sample range from –0.55 to 0.31, so from men being 55 percentage points more visible to women being 31 percentage points more visible in the media.
Method for meta-analysis
The average d’ score and the effect of moderators was estimated using meta regression. Because publications could have several results, derived from multiple samples or media, dependency in the effect sizes was taken into account using robust variance estimation with random effects weights, implemented in the robumeta package (Hedges, Tipton, & Johnson, 2010; Tanner-Smith & Tipton, 2014; Tipton, 2015). Variances were calculated as the inverse of the weight (w), where |$w=\frac{N}{1-d{^\prime}^2}$|, in which |$N$| is the number of politicians in the sample (Rosenthal, 1984, p. 71). Robustness analyses with fixed effects weights, weights calculated with the 10-log of the number of candidates, and (clustered and weighted) ordinary least squares estimates can be found in Supporting Information Appendix B, Table B1. We use the score based on the most specified model available in the main analyses, and include a dummy indicating the score is corrected using controls (1 = yes; 0 = simple means). In Supporting Information Appendix B, Table B2, we replicate the analyses, excluding studies with control variables (specification 9), studies for which the number of politicians needed to be estimated (specification 10), and scores that needed recalculations (specification 11).
Results on quantity of coverage
Over all studies, is there a difference in visibility between men and women politicians? Figure 2 displays the |$d^{\prime }$| score for the 70 cases in the 52 publications inspecting the visibility of candidates or politicians in the media. The figure shows both values well above 0 (men less visible), as well as below (women less visible), while the mean estimate is -0.036, with the 95% confidence interval (CI) ranging from -0.088 to 0.015. Thus, taken over all studies, women politicians are about 3.6 percentage points less visible in the media than men politicians, a slight difference that could be compatible with equitable reporting. At the same time, there is considerable variation between studies in the gender balance in visibility. The question, then, is whether these are systematic or arbitrary differences. To inspect this, we turn to the potential moderators of gender differences in news visibility.
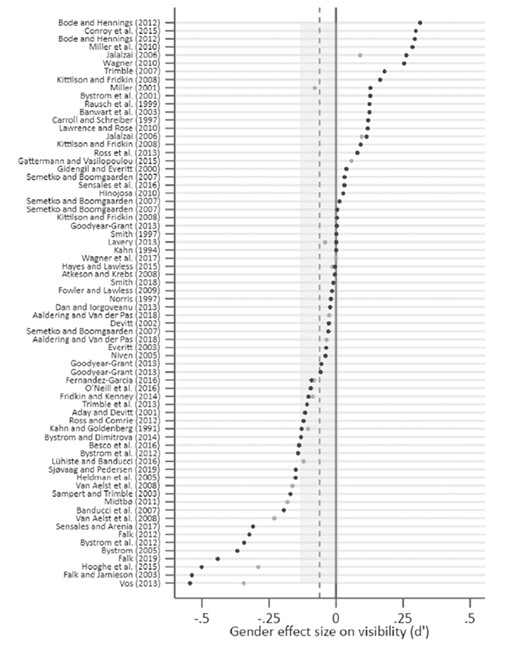
Effect of gender on media visibility. Note: d’ is the proportion of visibility for women minus the proportion of visibility for men. Black dots are zero-order visibility scores, grey dots are visibility scores that are statistically corrected for at least one control variable. The dashed line is the estimated mean of the zeroorder scores, with the 95% confidence interval in gray.
Models Explaining Difference in Visibility Between Men and Women Politicians (d’)
| Model Independent Variables | b | SE | dfs | p | ncat |
|---|---|---|---|---|---|
| Base, n = 70 | |||||
| Constant | –0.02 | 0.03 | 18.1 | 0.049 | — |
| Control variables (1=yes) | –0.10 | 0.05 | 25.6 | 0.458 | — |
| Office level, n = 70 | |||||
| Constant, 1. Supranational or mix | –0.04 | 0.07 | 5.0 | 0.533 | 8 |
| 2. National | 0.05 | 0.07 | 9.2 | 0.486 | 46 |
| 3. Sub-national | –0.03 | 0.08 | 9.9 | 0.700 | 16 |
| Control variables, 1 = yes | –0.09 | 0.05 | 20.6 | 0.072 | — |
| Office type, n = 70 | |||||
| Constant, 1. Executive | –0.04 | 0.04 | 13.3 | 0.295 | 25 |
| 2. Legislative | 0.03 | 0.05 | 17.8 | 0.617 | 34 |
| 3. Executive and legislative | –0.05 | 0.08 | 10.8 | 0.564 | 8 |
| 4. Other | 0.25 | 0.07 | 2.5 | 0.047 | 3 |
| Control variables, 1 = yes | –0.10 | 0.05 | 21.4 | 0.051 | — |
| Electoral system type, n = 68 | |||||
| Constant, 1. Plurality/majority | 0.01 | 0.03 | 13.1 | 0.759 | 48 |
| 2. Mixed member proportional | –0.03 | 0.04 | 1.9 | 0.624 | 6 |
| 3. Proportional representation | –0.17 | 0.03 | 8.2 | 0.001 | 14 |
| Control variables, 1 = yes | –0.02 | 0.03 | 8.8 | 0.458 | — |
| Election type, n = 70 | |||||
| Constant, 1. General election | 0.00 | 0.04 | 13.8 | 0.906 | 48 |
| 2. Primary election | –0.03 | 0.07 | 9.8 | 0.712 | 13 |
| 3. Both or not applicable | –0.09 | 0.04 | 9.1 | 0.061 | 9 |
| Control variables, 1 = yes | –0.11 | 0.05 | 24.4 | 0.028 | — |
| Campaign, n = 70 | |||||
| Constant, 1. Campaign | –0.01 | 0.04 | 17.6 | 0.833 | 55 |
| 2. Routine | –0.04 | 0.05 | 11.3 | 0.435 | 9 |
| 3. Both | –0.17 | 0.07 | 5.1 | 0.047 | 6 |
| Control variables (1=yes) | –0.06 | 0.04 | 18.1 | 0.181 | — |
| Time, n = 70 | |||||
| Constant, 1,960 | –0.06 | 0.11 | 4.4 | 0.629 | — |
| Time, 1 = 10 years | 0.01 | 0.03 | 4.5 | 0.768 | — |
| Control variables, 1 = yes | –0.10 | 0.05 | 24.8 | 0.050 | — |
| Female representation, n = 66 | |||||
| Constant (0%) | 0.10 | 0.04 | 22.5 | 0.027 | — |
| Female representation, 1 = 10% | –0.06 | 0.02 | 9.4 | 0.003 | — |
| Control variables, 1 = yes | –0.06 | 0.04 | 15.9 | 0.146 | — |
Note: Robust variance estimation with random effects weights. b = regression coefficients; dfs = degrees of freedom (dfs); ncat = number of observations per category of the main independent variable. Note that robust variance estimates with degrees of freedom lower than 4 may be untrustworthy (see Tipton, 2015).
Explaining Differences in Visibility: Properties of Proportional Representation Systems
| Model | Independent variable | b | dfs | p | n |
|---|---|---|---|---|---|
| Least squares index | –0.001 | 11.0 | 0.845 | ||
| 1 | Control variables, 1 = yes | –0.147 | 17.9 | 0.028 | 66 |
| Constant | 0.003 | 10.6 | 0.960 | ||
| Effective number of parties | –0.047 | 7.0 | 0.001 | ||
| 2 | Control variables, 1 = yes | –0.048 | 7.3 | 0.202 | 66 |
| Constant | 0.112 | 14.2 | 0.009 | ||
| Personal orientation | 0.192 | 4.5 | 0.003 | ||
| 3 | Control variables, 1 = yes | –0.067 | 5.8 | 0.080 | 59 |
| Constant | –0.631 | 3.6 | 0.005 | ||
| Europe dummy, 1 = yes | –0.124 | 19.6 | 0.007 | ||
| 4 | Control variables, 1 = yes | –0.070 | 18.7 | 0.119 | 70 |
| Constant | 0.026 | 20.7 | 0.359 | ||
| Personal orientation | 0.157 | 3.4 | 0.159 | ||
| 5 | Europe dummy, 1 = yes | –0.040 | 2.6 | 0.677 | 59 |
| Control variables, 1 = yes | –0.077 | 6.1 | 0.036 | ||
| Constant | –0.500 | 3.8 | 0.176 | ||
| Personal orientation | 0.106 | 2.7 | 0.217 | ||
| 6 | Effective number of parties | –0.025 | 5.6 | 0.244 | 59 |
| Control variables, 1 = yes | –0.052 | 6.8 | 0.136 | ||
| Constant | –0.287 | 2.7 | 0.331 | ||
| Europe dummy, 1 = yes | –0.049 | 5.8 | 0.548 | ||
| 7 | Effective number of parties | –0.037 | 9.2 | 0.086 | 66 |
| Control variables, 1 = yes | –0.064 | 9.5 | 0.108 | ||
| Constant | 0.108 | 11.8 | 0.023 |
Note: Robust variance estimation with random effects weights for number of candidates. b = regression coefficients; dfs = degrees of freedom. Note that robust variance estimates with degrees of freedom lower than 4 may be untrustworthy (see Tipton, 2015). The effective number of parties is the effective number of parliamentary parties score (Gallagher & Mitchell, 2005).
Table 2 displays the coefficients of separate models for each of the moderators. Based on the literature, we expected more gender biased coverage for higher political offices and for executive functions, because of the stronger masculine stereotype associated with these offices. Contrary to this, the models on office level and office type show that the coefficients could well be zero, and that even the direction of the effects does not form a convincing pattern.5
Next, we expected that institutions that foster a personalized electoral connection would lead to larger gender effects on coverage, but the evidence points in the opposite direction. In fact, a significant, negative gender gap in media attention is found in countries with proportional representation. In countries with plurality/majority voting, represented in the data by the United States (32 studies), Canada (12), the United Kingdom (3), and Australia (1), the d’ is estimated at 0.002 (95% CI from –0.042 to 0.046), while in proportional representation (PR) systems it is estimated at –0.167 (95% CI from –0.221 to –0.112). Concretely, this means that men politicians are 17 percentage points more visible than women politicians in PR systems, while the difference is negligible in majoritarian systems. Countries with mixed-member elections, represented by Germany, New Zealand, and Venezuela, like majoritarian systems, show little gender bias, but with so few observations this result is rather provisional.
The considerable gender gap in PR countries raises the question of what it is about this system that leads to a lower media visibility of women politicians compared to men. The PR system is associated with more proportional electoral outcomes (i.e., a stronger association between vote share and seat share), a larger number of parties in the legislature, and, generally, fewer personal vote incentives (Andre, Depauw, & Martin, 2016; Gallagher & Mitchell, 2005). In addition, the PR systems in the meta-analysis data set all lie in one geographic region: namely, Europe. To understand which of these properties might drive lower female visibility, we regressed the gender difference in visibility on (1) Gallagher’s least squares index of disproportionality; (2) the effective number of parties; (3) the mean personal vote incentive of the electoral system, according to André et al. (2016)6; and (4) a European dummy. The results are shown in Table 3. Disproportionality has a near-zero effect (Model 1), while the effective number of parties (Model 2), the personal (rather than party) vote orientation (Model 3), and the European dummy (Model 4) significantly impact female media visibility when considered separately. When modelled together, none is significant, indicating that it is impossible to fully disentangle them empirically with these data (Models 5-7). Thus, although we cannot exclude that this is a European regional particularity, it seems that the personalized rather than party-centered orientation of the electoral systems and, possibly, a smaller number of parties in the party system lead to more gender-equal media attention to politicians.
The remaining hypothesized moderators do not affect gender balance in the amount of coverage. Thus, it does not matter whether primary or general elections, routine or campaign periods, the 1980s or the 2010s are studied. The level of female representation seemingly (and surprising) has a detrimental effect on female visibility, but this is driven by the fact that female representation tends to be high in the European countries with PR systems. When combined in one analysis, the negative effect of proportional representation remains, while the effect of female representation becomes positive and non-significant (see Supporting Information Appendix B, Table B3). We additionally inspected whether the type of medium matters, and found some indication that TV provides a more disadvantaged stage for women politicians, as compared to newspaper coverage. The studies inspecting TV coverage had about 19 percentage points lower visibility scores for women politicians (b = –0.187; p = .022), and studies covering both TV and newspapers likewise reported lower visibility for women politicians, relative to newspapers (b = –0.130; p = .227). The latter result, however, is only based on three studies and, as such, must be interpreted with caution. Therefore, we see this as an indication—and not a sure sign—that TV coverage might be less equitable than newspapers in the amount of attention devoted to men and women politicians. Further, we found no differences between types of newspapers (tabloid vs quality).7
Finally, we inspected how knowledge on media visibility is accumulated in the field, by considering the gender composition of authors and citation patterns of studies (full results in Supporting Information Appendix B, Table B3, and Appendix C). First, unsurprisingly, most studies into media attention on men and women politicians are conducted by a female author or fully female team (49), while 15 studies are by gender-mixed teams, and only 6 are by a male author or a fully male team. Interestingly, there is a relation between the gender of the authors and the outcome on gender bias in visibility: the larger the share of female authors (from 0 to 1), the more equal the visibility result (b = 0.097; p = .085). On average, fully male teams report a mean gender gap in visibility of –0.158 to the disadvantage of women politicians, mixed teams report an average d’ of –0.147, while fully female–authored studies report about equal visibility at a d’ of 0.032. Second, a similar pattern is apparent in the relation between the reported result, the gender of authors of publications, and the number of times the study is cited. Male authors are, on average, cited more; moreover, male authors are cited more when they find women are less visible, while female authors are cited more when they find men are less visible. Lastly, in relation to the conflicting narratives in summaries on the field, how widely a publication is cited depends both on the results and the timing of the study. Among studies published before 2002, those reporting lower visibility for women politicians are cited equally or more; among the studies published after 2002, the opposite holds, and reporting a lower visibility for men politicians leads to more citations. Given the overall outcome of about equal visibility, this could be seen as the field (over)correcting itself from early impressions of starkly unequal attention.
Results on quality of coverage
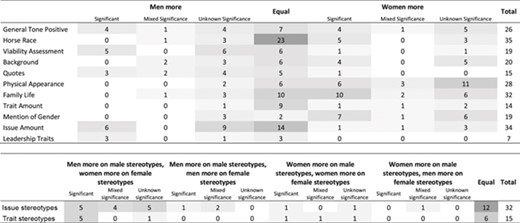
We now turn our attention to differences in the ways politicians are discussed, based on (1) expectations regarding stereotype incongruence; (2) lower viability estimations; (3) the link between women and private life; and (4) issue and trait stereotypes. Table 4 presents an overview of gender differences in the different aspects of media content, based on our coding of 90 studies on these topics (a detailed list of which studies find which results can be found in Supporting Information Appendix D).
Summary of Gender Differences in the Content of Media Coverage
 |
|
Note: Darker shades of gray are used for cells with higher numbers, indicating more studies falling into that category.
Summary of Gender Differences in the Content of Media Coverage
|
|
Note: Darker shades of gray are used for cells with higher numbers, indicating more studies falling into that category.
First, the table summarizes the findings concerning the tone of the media coverage in which politicians are portrayed. The incongruence between what is generally desired from leaders and what from women gives rise to the expectation that women politicians are evaluated more negatively in the media. Conroy et al. (2015, p. 575) even maintain that gender differences in the tone of the news coverage are “largely a well-established phenomenon.” However, some expect women politicians to have an advantage over their male colleagues (e.g., Lühiste & Banducci, 2016). The empirical findings are rather mixed: about an equal number of studies show that men politicians are portrayed more positively, that women politicians are portrayed more positively, and that there is no difference in the tone of the coverage between male and female politicians. The data do not suggest that the country or region, type or level of the political office, type of medium, or time moderates the relationship. Thus, based on these studies, we conclude that there is no clear indication of a gender bias in the tone of the coverage of politicians. Besides prompting negative evaluations, stereotype incongruence could also lead the media to amplify non-stereotypical behavior, such as attack behavior by women, and lead to more interpretative coverage. This gendered mediation has been examined in too few studies to summarize in the table, and all are by Gidengil and Everitt, on the coverage of leader debates in Canada. They show that women politicians are described in more aggressive terms and with an overemphasis on combative behavior (Gidengil & Everitt, 1999, 2003a, 2003b), and that women politicians receive less descriptive and more mediated coverage (i.e., analytical or evaluative, both labeled as interpretative coverage; Gidengil & Everitt, 2000,, 2003b).
Second, gender stereotypes likely affect the perceived viability of the politicians and, by consequence, their viability coverage. This type of reporting focuses on the question of whether the candidates can stay in the race and what their chances are of winning the elections. Specifically, studies examine whether there are gender differences in the amount of horse race coverage, in the assessment of viability, on the amount of professional background information (such as information on previous functions and experience), and in the number of quotes of politicians that are printed in the reporting. The overall evidence supporting the assumption that viability coverage is favorable for men politicians is present, but weak.
Let us start with the amount of horse race coverage: most studies that examined this type of coverage measured horse race reporting by coding news reports on election polls, but some also included other aspects; for instance, who has a stronger campaign organization, a discussion of the performance of candidates in the campaign (Kahn, 1994), or the campaign tactics that were used and where the candidates campaigned (Devitt, 2002). The findings in Table 2 are most consistent with no gender difference in the amount of horse race coverage, as 23 out of 35 studies report equal amounts of horse race coverage for male and female politicians. The second aspect of viability coverage is the assessment of the viability of politicians in the reporting. This includes how the electoral chances are evaluated by journalists—for instance, as competitive or as a “sure loser”—and, thus, the assessment of a candidate’s electability (Bode & Hennings, 2012), but also, for example, “whether the candidate had contact with the president or whether the candidate is unfit for the job” (Niven, 2005). There is some indication that male candidates receive favorable treatment, as most studies show that the viability assessment is more positive for male candidates, some studies show equal evaluations for men and women politicians, while studies that show that a viability assessment is in favor of women politicians are very rare. Third, focusing on the professional background of politicians, the findings are not clear-cut. There are more studies that show that women politicians receive more background coverage than studies that show more reporting on male politicians’ professional track records but, at the same time, many studies show no gender difference in terms of the amount of background reporting. Fourth, the number of direct quotes of politicians that are included in the reporting also show an advantage for men: most studies show that men politicians are more often cited than women, some show no gender difference, and only one shows that women are more often quoted.
Thus, most evidence supports the assumption that viability coverage is favorable for male politicians, although with some mixed results. Even though men and women politicians receive same amounts of horse race coverage and possibly also equal amounts of professional background coverage, the findings show that men are portrayed more positively in viability assessments and are quoted more often. It is noticeable that this aspect of media coverage is hardly studied outside North America. Thus, these conclusions are convincing for viability coverage of political candidates in the United States and in Canada, but must be drawn more cautiously for the rest of the world.
Third, as women are stereotypically associated with the private sphere instead of public life and politics, the media could be expected to focus more on the personal lives of female politicians. We distinguish four relevant categories in personal coverage: media reporting on the physical appearance of a politician, on his/her family life, personality coverage (i.e., the amount of personality trait coverage), and whether the gender of the politician is discussed. The findings in Table 2 show that in three of these four categories there is a clear gender gap: women politicians receive more media coverage that focuses on their looks than male politicians, woman politicians receive more family-related personal coverage than male politicians, and gender is mentioned more often for women politicians than their male colleagues. One category shows a different picture: for the amount of trait coverage, the results indicate that there is likely no gender bias, as most studies find that men and women politicians receive equal amounts of personality coverage.
Thus, women politicians are more often discussed in terms of their gender, their family life, and their physical appearance, but not in terms of their personality. Even though the results are not unequivocal, the overall picture is that women politicians receive more personal coverage than their male colleagues. This could be disadvantageous for female politicians: personal coverage highlights non-political aspects of politicians, which might affect the way voters evaluate the political actor.
The most important consequence of a stronger focus on the personal life of women politicians, compared to their male colleagues, it that this type of coverage might be at the expense of media reporting on the politician’s political standpoints. The empirical evidence for less issue coverage for female politicians, however, is somewhat ambiguous: a large number of studies find no gender difference and a large number show that men politicians receive more issue coverage. However, of the latter group, in most cases significance is not tested. Based on these findings, we conclude that there might be a weak gender bias in the amount of issue coverage in favor of male politicians. It should be noted that research that focusses on issue coverage, again, is very North America–focused, and to draw convincing conclusions about whether women politicians in other parts of the world receive less issue coverage than their male counterparts, much more research is needed.
Fourth, media coverage might simply reflect gendered stereotypes. We distinguish three categories: media coverage reflecting issue stereotypes, trait stereotypes, and the masculine leadership stereotype. Based on stereotypical thinking, certain policy issue competencies are linked to men and others to women. Accordingly, it is often hypothesized that women politicians are more often discussed in media coverage in relation to so-called feminine issues, while on stereotypical masculine issues, men politicians should be overrepresented. The findings in Table 2 show that, although there are quite a lot of studies that find that men politicians are mainly covered on masculine issues and women politicians on feminine issues, the combined evidence for this hypothesis is not overly convincing, as many other studies show no gender bias in the type of issue coverage. However, these results also do not warrant a rejection of the hypothesis. There is reason to believe that there might be a weak effect of issue stereotypes on the coverage of men and women politicians in terms of their coverage on issues, which perhaps is not always detected in all of these studies because of a lack in statistical power in many of them. Consequently, the conclusion is somewhat unsatisfying: there might be reason to believe that there is a gender bias in the content of issue covering, but more research is needed in this respect.
Similar to the expectation with issue stereotypes, the hypothesis concerning trait coverage that is most often studied is that women politicians are mainly covered in the media in terms of feminine stereotype traits, while men politicians are mostly covered based on masculine traits.8 As Table 2 shows, the results are as unclear as to issue stereotypes. This aspect is not studied that frequently but, when it is studied, researchers show that politicians are mainly covered in terms of the traits belonging to their gender stereotype, as often as they show that there is no gender effect in trait stereotype coverage. Thus, again, we come to the conclusion that more research is needed in this respect to convincingly accept or reject this hypothesis, but that the combined results give us reason to believe that there might be a weak gender bias in trait stereotype coverage of politicians. It should be noted, however, that the 15 studies almost exclusively focus on newspaper coverage during campaign periods and, thus, these conclusions cannot easily be transformed to television coverage and media coverage during times of routine politics.
Then, there is a subgroup that does not focus on gender differences in trait coverage based on “regular” gender stereotypes, but specifically on gender differences in the way politicians are portrayed in terms of their leadership traits. Leadership traits are those character traits in politicians that are important for voters when they cast their ballot. Hayes and Lawless (2015) include the four traits from the seminal work of Kinder (1986), of competence, leadership, integrity, and empathy; Valenzuela and Correa (2009) include the traits of charisma/compassion, honesty, leadership, aggressiveness, and competency; and Aaldering and Van der Pas (2018) include political skills, vigorousness, integrity, communicative skills, and consistency. The findings concerning leadership trait coverage are mixed and the conclusion is a cautious one: it is likely that men politicians are more often portrayed in the media in terms of their leadership traits but here, as well, more research is needed.
Conclusion
Are journalists biased against female politicians? We systematically analyzed 90 studies covering over 4,000 women politicians and over 750,000 coded media stories to answer this question. Our meta-analysis of visibility suggests that there is a gender bias in the amount of media coverage in PR systems, where women politicians receive about 17 percentage points less media attention. Surprisingly, there seems to be little gender bias in media visibility in majoritarian electoral systems. Also, there is an indication that the gender difference in media visibility of politicians is larger on TV than in newspapers. However, we pose this as a new hypothesis for future research, as there is more empirical research needed that focuses on TV coverage to draw a sure conclusion. None of the other explanations generally offered for when the visibility gap should be larger or smaller was able to account for differences in relative female visibility between studies. This is a striking and new insight, given the scarcity of research into the conditions of gender bias due to the resource intensity of comparative work.
It was expected that electoral systems with a strongly personalized connection between representatives and the represented, such as majoritarian systems, would produce larger gender effects on media visibility. The results are to the contrary: in party- rather than person-oriented systems, women appear to be disadvantaged in the media. These surprising results beg the question of why this apparent inequality exists in PR systems. Although the level of personal orientation has the strongest observed effect, we cannot fully disentangle empirically whether the lower effective number of parties, the party (rather than personal) vote orientation, or something particular about Europe is at play here. However, a possible hypothesis that might be tested in future work is that in electoral contexts dominated by parties, there is more specialization among politicians within parties. If this division of labor is done along gender lines, and men tend to take on media relations, this might explain the lower media visibility of women in countries with PR systems.
The review of gender bias in the content of the media coverage of politicians provides support for some widely held expectations concerning the favorability of media reporting of male politicians, while others are debunked. The combined studies show while that the viability assessments are largely in favor of men politicians (even though there is no gender difference in the amount of horse race coverage), women politicians receive more appearance and family coverage than their male colleagues, their gender is more often mentioned, their combative behavior is exaggerated, and there is reason to believe that politicians are mainly portrayed in accordance with the issues and traits belonging to their gender stereotype. On the other hand, there is little evidence for gender-differentiated coverage in the general tone in which politicians are portrayed and in the amount of issue coverage politicians receive.
Thus, the findings of this study lead to the conclusion that the media cover men and women politicians differently. The effect of this gender bias in media coverage is highly likely to be detrimental for women politicians. As higher visibility of parties and candidates results, on average, in an increased likelihood to vote for that party/candidate (Aaldering et al., 2018; Kiousis & McCombs, 2004), male politicians in PR systems have a clear advantage over their female colleagues. Also, the gender bias in the way politicians are covered in the media is beneficial for men: their electability is covered more positively and there is less focus on their personal lives. In addition, they benefit from the fact that they are more strongly associated with masculine issues and traits, which are more highly valued in politics by many (Koenig et al., 2011). Thus, the media bias likely contributes to the almost universal descriptive underrepresentation of women in politics that still exists worldwide.
This study is, of course, not without limitations. Most importantly, many studies included in this research are focused on the United States, not only because the field is dominated by scholars studying American politics, but also because publication in English is one of the criteria for inclusion. This probably led to an underrepresentation of studies from countries where publication in English is not the norm, and the conclusions that we draw are therefore strongest for the United States (and other English-speaking countries), while generalizability to other countries is more limited.
Finally, we end by pointing out three promising directions in which to move forward. First, we excluded studies that have a purely qualitative approach towards gender bias in media coverage from our analyses. A review of the results of these studies would be a very valuable contribution to the field, as some concepts might be only detected in these more in-depth examinations of media coverage. An example is the focus on health issues and the framing of Hillary Clinton as too hysterical to lead the United States in the 2016 campaign (Neville-Shepard & Nolan, 2019). Also absent in our analysis are intersectional differences in media coverage of politicians, which tease out how not only gender but also ethnicity or race are related to media bias (e.g., Ward, 2016, 2017). We urge colleagues to take on these challenges and to provide a review on the scholarship that was outside the scope of this paper but might uncover new and relevant insights.
Second, the question posed in this article was one about bias: that is, whether journalists treat women politicians differently. To answer this, ideally everything that matters except the gender of the politician is held constant. Many studies endeavor to do this either by examining arguably similar politicians or by controlling statistically for factors like political status and experience. However, relatively few studies take the campaign and other communication on the part of politicians into account, in spite of the early example set by Kahn (e.g., Kahn, 1994; Kahn & Goldenberg, 1991; see also Gidengil & Everitt, 1999, 2003a, 2003b). It is even harder to observe the informal behavior of politicians toward journalists, except in qualitative comparisons (e.g., Goodyear-Grant, 2013). Given that certain differences in coverage have been established in a fair number of studies, a stronger emphasis on whether these differences in fact stem from journalistic bias is now warranted. This can be done either by combining media content analysis with information on politicians’ campaigns and networks or by exploring new methods, such as through experiments on journalists.
Third, the field would benefit from a stronger focus on the mechanism that can explain the gender bias. If differences in coverage indeed stem from journalistic bias, how exactly does that differential treatment come about? We have outlined three potential mechanisms in this article—news values, gendered networks, and stereotypes—but we lack empirical evidence on whether these indeed drive the observed outcomes. For example, coverage in line with gender stereotypes arguably comes from stereotyping by journalists, but the cognitive processes by which journalists arrive at this type of reporting remains a black box (cf., Bauer, 2015). In addition, the role of networks in gender-differentiated political coverage is currently understudied. How do the formal and informal contacts between politicians and journalists figure in the gender bias in political reporting? A better understanding of these mechanisms is crucial, as only by understanding how gender bias comes about can we select effective remedies.
Supporting Information
Additional Supporting Information may be found in the online version of this article.
Please note: Oxford University Press is not responsible for the content or functionality of any supplementary materials supplied by the authors. Any queries (other than missing material) should be directed to the corresponding author for the article.
Acknowledgments
Daphne Van der Pas was supported by a grant from Nederlandse Organisatie voor Wetenschappelijk Onderzoek (Grant 451-17-025). The authors are grateful to the anonymous reviewers and the editor for providing constructive comments, and to all the authors that provided information and data. In addition, the authors would like to thank Susan Banducci, Angela Bos, Mirya Holman, Monica Schneider, Angela Wagner, the Political Communication research group at the University of Vienna, the Challenges research group at the University of Amsterdam, participants at the MPSA and EPSA Conferences in 2018, and the Gender and Media ICA-Postconference in 2019 for their feedback.
Notes
1 By “politician,” we refer to both candidates and political office holders.
2 We use the term “gender” to denote the sex of the politician as publicly known.
3 The precise wording of the search term is: (“Content analysis” OR “content analyses”) AND (coverage OR reporting OR reports OR news OR media OR press OR TV OR newspaper) AND (gender OR sex OR (male AND female) OR (men AND women)) AND (political OR politician OR politics OR leader).
4 We did not use a standardized difference between means as a measure of effect size because, for a large number of the studies, the standard deviations of the means were not reported and were irretrievable.
5 To ensure functional equivalence of office levels and office types, we alsoper formed this analysis on studies in the United States only. Also, in these 34 studies, no convincing pattern between office level and type and the relativevisibility of men and women politicians was found. Analyses are available uponrequest.
6 Each study was assigned the mean personal vote orientation of their electoral system as reported by André et al. (2016, p. 47). André and colleagues distinguish between the closed-list proportional, flexible-list proportional, open-list proportional, single-member plural, single transferable vote, and two-round systems, which have scores of 2.37, 2.43, 3.16, 3.38, 3.57, and 3.41, respectively, on a 5-point scale, with higher numbers indicating a more personal vote orientation. European Parliament elections use different types of list systems, so the three studies covering these elections are excluded from this analysis. Assigning the three studies the mean score of the three types of proportional system does not change the results.
7 The studies that control for politicians’ own communication have about 7 percentage points lower d’ scores (b = −0.067): a difference with studies without controls that is not statistically significant (p = .309). Studies that only control for political factors also report lower d’ scores than studies with no controls, but also not significantly so (b = −0.076; p = .139). Full results are available upon request.
8 Within the gendered political media coverage literature, Kahn and Goldenberg (1991, p. 195) were the first to study this topic and operationalized masculine traits by“independent, objective, competitive, strong leader, insensitive, aggressive, unemotional, ambitious, and tough” and feminine traits by “dependent, noncompetitive, passive, gentle, emotional, weak leader, and compassionate.”
(References marked with an asterisk are included in the meta-analysis and/or review.)
References
*
*
*
*
*
*
*
*
*
*
*
*
*
*
*
*
*
*
*
*
*
*
*
*
*
*
*
*
*
*
*
*
*
*
*
*
*
*
*
*
*
*
*
*
*
*
*
*
*
*
*
*
*
*
*
*
*
*
*
*
*
*
*
*
*
*
*
*
*
*
*
*
*
*
