


Abstract
Background: The widespread use of cellular telephones has heightened concerns about possible adverse health effects. The objective of this study was to investigate cancer risk among Danish cellular telephone users who were followed for up to 21 years. Methods: This study is an extended follow-up of a large nationwide cohort of 420 095 persons whose first cellular telephone subscription was between 1982 and 1995 and who were followed through 2002 for cancer incidence. Standardized incidence ratios (SIRs) were calculated by dividing the number of observed cancer cases in the cohort by the number expected in the Danish population. Results: A total of 14 249 cancers were observed (SIR = 0.95; 95% confidence interval [CI] = 0.93 to 0.97) for men and women combined. Cellular telephone use was not associated with increased risk for brain tumors (SIR = 0.97), acoustic neuromas (SIR = 0.73), salivary gland tumors (SIR = 0.77), eye tumors (SIR = 0.96), or leukemias (SIR = 1.00). Among long-term subscribers of 10 years or more, cellular telephone use was not associated with increased risk for brain tumors (SIR = 0.66, 95% CI = 0.44 to 0.95), and there was no trend with time since first subscription. The risk for smoking-related cancers was decreased among men (SIR = 0.88, 95% CI = 0.86 to 0.91) but increased among women (SIR = 1.11, 95% CI = 1.02 to 1.21). Additional data on income and smoking prevalence, primarily among men, indicated that cellular telephone users who started subscriptions in the mid-1980s appeared to have a higher income and to smoke less than the general population. Conclusions: We found no evidence for an association between tumor risk and cellular telephone use among either short-term or long-term users. Moreover, the narrow confidence intervals provide evidence that any large association of risk of cancer and cellular telephone use can be excluded.
Worldwide use of cellular telephones has raised concerns about possible adverse health effects ( 1 ) . During operation, the antenna of a cellular telephone emits radio frequency electromagnetic fields that can penetrate 4–6 cm into the human brain ( 2 , 3 ) . In view of the localized nature of exposure during cellular telephone use, research has focused on tumors of the head and neck, particularly brain tumors ( 4 – 20 ) , salivary gland tumors ( 8 , 11 , 21 ) , and uveal melanomas ( 8 , 22 , 23 ) . To date, the overall epidemiologic evidence suggests no increased risk for any tumor among cellular telephone users with less than approximately 10 years of use. Most studies have not found a statistically significant overall association with the risk of brain tumors for use of 10 or more years ( 12 – 15 , 18 – 21 ) , except for two ( 16 , 17 ) , for which methodologic issues have been raised ( 24 ) . Because cellular telephones were introduced relatively recently, most studies have comparatively few subjects who have used cellular telephones for 10 or more years.
In 2001, we reported the results of a nationwide cohort study on cancer risk among 420 095 cellular telephone subscribers in Denmark ( 8 ) . We did not observe an increased risk for any specific cancer type, including brain tumors, salivary gland tumors, leukemia, and uveal melanoma. Although the cohort included persons whose subscriptions had started between 1982 and 1995, most cohort members had used cellular telephones for only a few years. In this study, we present a follow-up of the cohort through 2002, with a maximum time for cellular telephone use of 21 years and a mean time of 8.5 years, enabling us to investigate further the cancer risk among long-term subscribers. We also present data on the average income of cellular telephone subscribers to examine in more detail the possible relationships between income, cellular phone ownership, and risk for cancer. In addition, we comment on the quality and usefulness of subscriber lists to estimate cellular telephone usage by comparing these data with self-reported data obtained from a structured survey questionnaire.
S UBJECTS AND M ETHODS
Study Population
The composition of the cohort has been reported previously ( 8 ) . In brief, we received records of all 723 421 cellular telephone subscriptions in Denmark during the period 1982–1995. From these, 200 507 corporate subscriptions were deleted because the individual users could not be identified. A further 102 819 records were excluded because of duplicate addresses (one of them removed), errors in name or address, or a nonresidential address or because the subscriber was under 18 years of age at first subscription, the subscriber was a permanent resident of Greenland or the Faroe Islands, or the subscriber asked to be excluded from the study (n = 53). The final study cohort included 420 095 private cellular telephone subscribers.
Through record linkage of cohort members by name and address with the Central Population Register, personal identification numbers were obtained, with data on vital status, date of death, or date of emigration. Using the personal identification number, cohort members were linked to the files of the Danish Cancer Registry to ascertain incident cases of cancer. The Cancer Registry, which began reporting incidence on a nationwide scale in 1943, is virtually complete ( 25 ) and includes benign brain tumors. Cohort members with a history of previous cancers, except nonmelanoma skin cancer, before their first cellular telephone subscription were excluded. Follow-up began on the date of first subscription and ended on the date of first cancer diagnosis (except for nonmelanoma skin cancer), date of death, date of emigration, or December 31, 2002, whichever came first. Cancers were classified according to a modified Danish version of the International Classification of Diseases, 7th Revision ( 26 ) , and since 1978 according to the International Classification of Diseases for Oncology ( 27 ) . Smoking-related cancers were classified according to the system of Olsen et al. ( 28 ) .
The study was approved by the Danish Ethical Committee System (KF 01-075/96), the Danish Data Protection Board (1996-1200-121), and the Danish Ministry of Justice (Jnr. 1996-760-0219). The study was entirely based on record linkage, and no one was aware whether he or she was included. After the study became public through the media, the network providers published in their quarterly reports a notice that subscribers could contact them if they wished to be excluded from the study. A total of 53 persons (see above) contacted the network providers in this regard.
Statistical Analysis
The numbers of cancers observed were compared with those expected, which were calculated by multiplying the number of person-years of cohort members by the overall and site-specific incidence rates of primary cancer (first cancer diagnosis) among men and women in the general population of Denmark ( 29 ) , in 5-year age groups and calendar periods of observation. To exclude cohort members from the reference population, the number of cancer case patients and person-years observed in the cohort were subtracted from the corresponding figures for the total Danish population and a new set of incidence rates created. Standardized incidence ratios (SIRs) for cancer and 95% confidence intervals (CIs) were calculated on the assumption of a Poisson distribution of the observed cancers ( 30 ) . Standardized incidence ratios for brain tumors were also calculated by morphology and anatomic site, and standardized incidence ratios for brain tumor and leukemia were calculated by time since first subscription. Ptrend (two-sided) values in the analysis by time since first subscription were calculated using the Poisson trend statistic. Ptrend <.05 was considered statistically significant.
To compare the average annual incomes of cellular telephone subscribers and the general population, data on annual income stratified by 5-year age group and sex were retrieved from Statistics Denmark for 1985–1995. Differences in income distributions were analyzed by plotting average income by age for cellular telephone subscribers and for the total Danish population. To investigate whether these differences changed over time, we chose to present data for the first and last years they were available, i.e., 1985 and 1995.
We also had access to self-reported use of cellular telephones by Danish participants in a recent population-based case–control study of the causes of brain tumors (Interphone study) ( 14 ) . During a personal interview, persons participating in the Interphone study were asked how long they had been regular cellular telephone users, which was defined as making or receiving at least one call per week over a period of 6 months or more ( 31 ) . On this basis, we classified all 822 Danish Interphone control subjects as either regular cellular telephone users in 1982–1995 or not. We then linked this group with our cohort by personal identification numbers and evaluated how many subscribers compared with nonsubscribers reported that they were regular cellular telephone users. We also performed sensitivity analyses to estimate the effect of attenuation of relative risk estimates resulting from misclassification of exposure.
R ESULTS
Of the 420 095 cellular telephone subscribers in the cohort, 357 553 were male and 62 542 were female. The mean time since first cellular telephone subscription was 8.5 years, and the median was 8.0 years. Among the male subscribers, 304 349 (85.1%) had their subscription for less than 10 years, 42 549 (11.9%) for 10–14 years, and 10 655 (3.0%) for 15–21 years (maximum). Among the female subscribers, the corresponding values were 59 098 (94.5%), 3 131 (5.0%), and 313 (0.5%), respectively.
A total of 14 249 cases of cancer were observed in the cohort of private cellular telephone subscribers, whereas 15 001 cases were expected (overall SIR = 0.95, 95% CI = 0.93 to 0.97; for men, overall SIR = 0.93, 95% CI = 0.92 to 0.95; for women, overall SIR = 1.03, 95% CI = 0.99 to 1.07) ( Table 1 ). Cellular telephone use was not associated with increased risks for tumors of the brain and nervous system (SIR = 0.97), salivary gland tumors (SIR = 0.77), eye tumors (SIR = 0.96), or leukemia (SIR = 1.00). Among men, the overall decrease in risk for cancer was attributable mainly to a decreased risk for smoking-related cancers (SIR = 0.88, 95% CI = 0.86 to 0.91); however, statistically significant decreased risks for individual cancers of the lung, buccal cavity, pharynx, esophagus, liver, and pancreas were also found. Among women also, the overall risk for cancer was not associated with cellular telephone use, but increased risks for smoking-related cancers (SIR = 1.11, 95% CI = 1.02 to 1.21) and cancers of the uterine cervix (SIR = 1.30, 95% CI = 1.08 to 1.54) and kidney (SIR = 1.42, 95% CI = 1.02 to 1.92) ( Table 1 ) were found.
Standardized incidence ratios (SIRs) and 95% confidence intervals (CIs) for selected types of cancer among 420 095 cellular telephone subscribers in Denmark, 1982–1995, followed up through December 31, 2002 *
| Men | Women | |||||||||
|---|---|---|---|---|---|---|---|---|---|---|
| Site of cancer (ICD-7) | Obs | Exp | SIR (95% CI) | Obs | Exp | SIR (95% CI) | ||||
| All cancers (140–205) | 11 802 | 12 627.0 | 0.93 (0.92 to 0.95) | 2447 | 2373.7 | 1.03 (0.99 to 1.07) | ||||
| Brain, nervous system (193) | 491 | 512.9 | 0.96 (0.87 to 1.05) | 89 | 86.8 | 1.03 (0.82 to 1.26) | ||||
| Salivary glands (142) | 26 | 30.2 | 0.86 (0.56 to 1.26) | 0 | 3.6 | 0.00 (0.00 to 1.02) | ||||
| Eye (192) | 38 | 40.5 | 0.94 (0.66 to 1.29) | 6 | 5.5 | 1.10 (0.40 to 2.39) | ||||
| Leukemia (204) | 318 | 317.3 | 1.00 (0.90 to 1.12) | 33 | 34.0 | 0.97 (0.67 to 1.36) | ||||
| All smoking-related sites | 3758 | 4250.7 | 0.88 (0.86 to 0.91) | 511 | 460.3 | 1.11 (1.02 to 1.21) | ||||
| Lung (162.0, 162.1) | 1379 | 1674.5 | 0.82 (0.78 to 0.87) | 209 | 193.0 | 1.08 (0.94 to 1.24) | ||||
| Larynx (161) | 187 | 212.3 | 0.88 (0.76 to 1.02) | 8 | 7.1 | 1.13 (0.49 to 2.22) | ||||
| Bladder (181) | 919 | 879.3 | 1.05 (0.98 to 1.11) | 51 | 44.4 | 1.15 (0.86 to 1.51) | ||||
| Buccal cavity/pharynx (145–148) | 132 | 208.6 | 0.63 (0.53 to 0.75) | 11 | 10.5 | 1.05 (0.52 to 1.87) | ||||
| Esophagus (150) | 190 | 229.3 | 0.83 (0.71 to 0.96) | 8 | 10.9 | 0.73 (0.32 to 1.45) | ||||
| Liver (155.0) | 98 | 122.7 | 0.80 (0.65 to 0.97) | 4 | 9.4 | 0.43 (0.11 to 1.09) | ||||
| Cervix uteri (171) | – | 129 | 99.4 | 1.30 (1.08 to 1.54) | ||||||
| Stomach (151) | 247 | 271.4 | 0.91 (0.80 to 1.03) | 14 | 19.9 | 0.70 (0.38 to 1.18) | ||||
| Kidney (180) | 366 | 372.3 | 0.98 (0.88 to 1.09) | 42 | 29.6 | 1.42 (1.02 to 1.92) | ||||
| Pancreas (157) | 240 | 280.3 | 0.86 (0.75 to 0.97) | 35 | 36.1 | 0.97 (0.68 to 1.35) | ||||
| Other sites | ||||||||||
| Breast (170) | 22 | 20.0 | 1.10 (0.69 to 1.67) | 711 | 682.4 | 1.04 (0.97 to 1.12) | ||||
| Prostate (177) | 1001 | 967.9 | 1.03 (0.97 to 1.10) | – | ||||||
| Testis (178) | 522 | 495.9 | 1.05 (0.96 to 1.15) | – | ||||||
| Other cancers | 5381 | 5670.2 | 0.95 (0.92 to 0.97) | 1055 | 1054.3 | 1.00 (0.92 to 1.09) | ||||
| Unspecified cancers (198, 199) | 245 | 321.4 | 0.76 (0.67 to 0.86) | 42 | 46.8 | 0.90 (0.64 to 1.21) | ||||
ICD-7 = International Classification of Diseases, 7th Revision (26); Obs = observed; Exp = expected; – = not applicable.
In addition to combining all brain tumors in one group, we examined the relative risk by brain tumor subtypes ( Table 2 ). Analyses by morphologic subtype of intracranial central nervous system tumors found no statistically significant increased risk of glioma (SIR = 1.01, 95% CI = 0.89 to 1.14), meningioma (SIR = 0.86, 95% CI = 0.67 to 1.09), and cranial nerve sheath tumors, including acoustic neuroma (SIR = 0.73, 95% CI = 0.50 to 1.03). Except for one case of unspecified morphology, all 31 cranial nerve sheath tumors were histologically confirmed as acoustic neuromas. Acoustic neuromas occur in the temporal lobe. When we combined data for gliomas and acoustic neuromas occurring in the temporal lobe, the risk for these cancers was not associated with cellular telephone use (85 observed versus ∼88 expected). Further subdivision of gliomas by anatomic site showed a small statistically nonsignificant elevated risk (SIR = 1.21) of cancers of the temporal lobes and a statistically significant decreased risk (SIR = 0.58) of cancers of the parietal lobes. The risk for gliomas occurring in the temporal and parietal lobes, which are anatomically closest to the antenna during use of cellular telephones, was not associated with cellular telephone use (SIR = 0.93, 95% CI = 0.73 to 1.17).
Standardized incidence ratios (SIRs) and 95% confidence intervals (CIs) for intracranial central nervous system tumors categorized according to ICD-O morphology and topography codes among 420 095 cellular telephone subscribers in Denmark, 1982–1995, followed up through December 31, 2002 (men and women combined) *
| Tumor category | Topography code | Obs | Exp | SIR (95% CI) |
|---|---|---|---|---|
| Glioma † | 191.0–191.9 | 257 | 253.9 | 1.01 (0.89 to 1.14) |
| Cerebrum | 191.0 | 58 | 62.6 | 0.93 (0.70 to 1.20) |
| Frontal lobe | 191.1 | 64 | 59.7 | 1.07 (0.83 to 1.37) |
| Temporal lobe | 191.2 | 54 | 44.5 | 1.21 (0.91 to 1.58) |
| Parietal lobe | 191.3 | 21 | 35.9 | 0.58 (0.36 to 0.89) |
| Occipital lobe | 191.4 | 12 | 10.5 | 1.14 (0.59 to 2.00) |
| Cerebellum | 191.6 | 5 | 5.4 | 0.93 (0.30 to 2.16) |
| Other and unspecified | 191.5, 191.7, 191.8, 191.9 | 43 | 35.4 | 1.21 (0.88 to 1.64) |
| Meningioma ‡ | ||||
| Meninges | 192.1 | 68 | 79.0 | 0.86 (0.67 to 1.09) |
| Nerve sheath tumors § | ||||
| Cranial nerves | 192.0 | 32 | 43.7 | 0.73 (0.50 to 1.03) |
| Other and unspecified ‖ | 191.0–191.9, 192.0, 192.1, 194.4 | 100 | 103.4 | 0.97 (0.79 to 1.18) |
Obs = observed; Exp = expected.
International Classification of Diseases for Oncology (ICD–O) morphology codes 93803–94813.
ICD-O morphology codes 95300–95393.
ICD-O morphology codes 95400–95700 (includes 31 acoustic neuromas that all occur in temporal lobe).
Other morphologies at 191.0–191.9, 192.0, 192.1, and 194.4.
Because risks may become apparent only after a longer latency period, we calculated the relative risks for brain tumors and leukemias by time since first subscription ( Table 3 ). The risk for brain and nervous system tumors was not associated with cellular telephone use among persons followed for less than 10 years since first exposure. For the 56 648 longer term subscribers accumulating 169 595 person-years at risk at 10 or more years after first exposure, the analysis was based on 28 observed cases and 42.5 expected (SIR = 0.66, 95% CI = 0.44 to 0.95). The risk of leukemias was also not associated with use, even among those who were followed for 10 or more years after first subscription to a cellular telephone service (SIR = 1.08, 95% CI = 0.74 to 1.52) ( Table 3 ).
Standardized incidence ratios (SIRs) and 95% confidence intervals (CIs) for brain and nervous system tumors and leukemias according to time since first subscription among 420 095 cellular telephone subscribers in Denmark, 1982–1995, followed up through December 31, 2002 (men and women combined) *
| Brain and nervous system | Leukemia | ||||||||||
|---|---|---|---|---|---|---|---|---|---|---|---|
| Latency † , y | Person-years | Obs | Exp | SIR (95% CI) | Obs | Exp | SIR (95% CI) | ||||
| <1 | 419 535 | 51 | 56.9 | 0.90 (0.67 to 1.18) | 33 | 30.4 | 1.09 (0.75 to 1.52) | ||||
| 1–4 | 1 656 211 | 266 | 256.3 | 1.03 (0.91 to 1.17) | 151 | 144.0 | 1.05 (0.90 to 1.24) | ||||
| 5–9 | 1 326 814 | 235 | 244.1 | 0.96 (0.84 to 1.09) | 135 | 147.3 | 0.92 (0.77 to 1.08) | ||||
| ≥10 | 169 595 | 28 | 42.5 | 0.66 (0.44 to 0.95) | 32 | 29.7 | 1.08 (0.74 to 1.52) | ||||
| Ptrend‡ | .51 | .69 | |||||||||
Obs = observed; Exp = expected.
Time since first cellular telephone subscription to the diagnosis of cancer.
Ptrend was calculated using the Poisson trend statistic (two-sided test).
To examine whether our cohort differed from the general population with regard to socioeconomic status, we compared their average annual incomes ( Fig. 1 ). The average annual income of private cellular telephone subscribers was higher than that of the general population, regardless of age and sex (data not shown for women). The income difference was more pronounced in 1985 than in 1995.
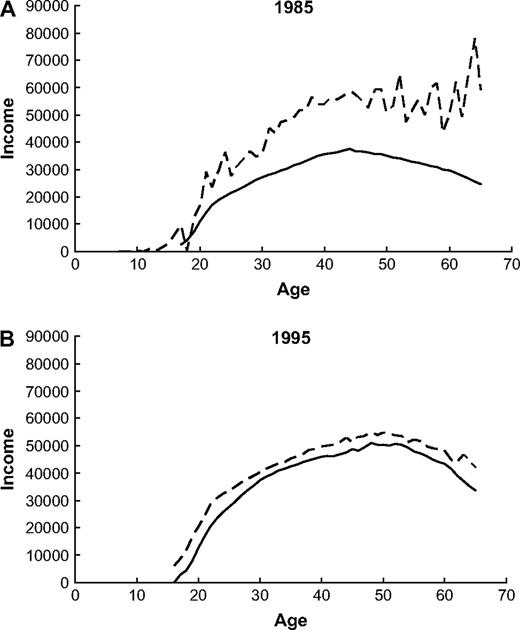
Average gross income in US dollars for male cellular telephone subscribers ( dashed line ) and all males ( solid line ) in Denmark by age. Gross income in A ) 1985 and B ) 1995.
To obtain insight into the potential of exposure misclassification, we compared our cohort data with data from another Danish study in which cellular telephone usage was assessed during a personal interview. Using record linkage between the 420 095 subscribers in the current study and the roster of 822 control subjects in our recent case–control studies of acoustic neuroma and brain tumor [Interphone ( 12 , 14 ) ] who completed a questionnaire with a full history of cellular telephone use, we identified 85 overlapping subjects. Regular telephone use was reported by 61% of the 85 subscribers in the cohort. Among the 737 control subjects who did not match the subscriber lists, 16% reported being regular cellular telephone users. Hence, members of our cohort were approximately four times more likely than the Danish population to report regular cellular telephone use before 1996.
To estimate the effect of attenuation of relative risk estimates resulting from misclassification of exposure, we performed sensitivity analyses by assuming that 61% of the subscribers and 16% of the nonsubscribers were actually regular cellular telephone users before 1996. Such misclassification would lead to an attenuated estimate of 1.2 when the actual relative risk is 1.5 and to an attenuated relative risk of 1.09 when the actual relative risk is 1.2. Because the percentage of regular cellular telephone users in the subscriber cohort is so much larger than the percentage in the rest of the Danish population, however, misclassification would not be expected to produce relative risk estimates that are less than 1.0 if there is, in fact, an increased risk among cellular telephone users.
D ISCUSSION
After extending the follow-up of a large, nationwide cohort of 420 095 cellular telephone subscribers, we found no increased risk for brain tumors, acoustic neuromas, salivary gland tumors, eye tumors, leukemias, or cancer overall associated with cellular telephone use. We also found no increased risk for all major histologic subtypes of brain tumors and for tumors in the most exposed regions of the brain ( 2 ) . In the first follow-up, which ended in December 1996, we also observed no increased risk for these cancer types. However, the average follow-up period was 3.1 years compared with 8.5 years in the current study, and, for example, the number of observed brain tumor cases was 154 compared with 580 cases in the current study ( 8 ) . In the current study, the maximum follow-up period was extended up to 21 years after first cellular telephone subscription, which allowed us to investigate brain tumor risk in subjects having a subscription for 10 years or more, and the number of brain tumors among such subscribers was lower than expected on the basis of the incidence rates in the general population.
Several other studies, all case–control in design, have reported risk estimates for long-term users of cellular telephones ( 14 – 17 , 19 , 20 ) . No statistically significant elevation in overall brain tumor risk has been found, except in one Swedish study that reported elevated risks for all subtypes of brain tumors among long-term users as well as short-term users ( 16 , 17 ) . Two published incident case–control studies in Denmark and Sweden, which were part of the Interphone study, reported slightly decreased risk estimates for both glioma and meningioma ( 14 , 15 ) . In Finland, selection bias due to nonparticipation was found to decrease the estimate of risk between cellular telephone use and incidence of brain tumors (32) , and such bias may have played a role in the deficits seen in the Danish and Swedish studies. Bias due to nonparticipation is not, however, a plausible explanation for the reduced brain tumor risk that we observed among long-term subscribers in this nationwide cohort study because the entire Danish population was included in the study.
We have found no biologically plausible evidence in the literature to support an inverse association between radio frequency electromagnetic fields and brain tumor development ( 1 ) . This finding of an inverse association is even more surprising because early cellular telephone subscribers had higher incomes than the general population, and brain tumors may be more frequent among persons with higher socioeconomic status, as reported in a US study ( 33 ) . However, the overall risk of brain tumor associated with cellular telephone use of all time intervals (SIR = 0.97; n = 580) was similar to that of the general population of Denmark. Among the subset of 56 648 subscribers followed for 10 or more years, the risk of brain tumors was statistically significantly low but the trend over time was not close to statistical significance ( P = .51). Although approximately 11 000 cohort members had subscribed for 15 or more years, the mean follow-up beyond 10 years of use for the 56 648 long-term subscribers was only 3.0 years; hence, the finding was based on only 28 cases. Thus, chance may be the explanation when the risk among a subgroup is found to be statistically significantly low, especially when many comparisons are being made. Nevertheless, negative confounding by an unknown or unmeasured factor cannot be ruled out because our cohort of the first, mainly male, subscribers of a cellular telephone appeared to be a unique subgroup of persons with a higher income (e.g., having particular occupations in which mobile communication was an advantage or they may be different with regard to lifestyle) and might therefore have a distinct risk profile. However, it is not clear why such a distinct risk profile would affect only one cancer type and not others. Further follow-up will be required to determine whether the brain tumor risk will remain decreased.
Our findings with respect to acoustic neuroma are of interest in view of the results of a recent pooled analysis from five countries (Denmark, Sweden, Norway, Finland, United Kingdom; part of the Interphone study) ( 18 ) . Although there was no increased risk in acoustic neuroma overall (odds ratio [OR] = 0.9) or among those using cellular phones for more than 10 years (OR = 1.0), a risk among long-term users could not be completely ruled out because a statistically significant increased risk (OR = 1.8) was found for tumors that developed on the same side of the head as reported the phone use. The risk for contralateral tumors was decreased (OR = 0.9), and, after considering multiple sources of potential bias, the authors concluded that no firm conclusions could be drawn. Our overall risk for acoustic neuroma (SIR = 0.73) was consistent with that from the Interphone study (overall OR = 0.9). We have no information, however, about which side of the head the subscribers in our cohort preferred when using a cellular telephone, but, even if a subgroup had an elevated risk, it could have been compensated for by an even greater decreased risk among the remaining persons.
We observed statistically significantly reduced risks among men for all cancers and for smoking-related cancers in particular. We suggest that this risk reduction may be due to fewer smokers in our cohort and to the likely healthier lifestyles and the higher income of cellular telephone users compared with the general population. Although female subscribers in our cohort also had higher incomes than women in the general population (data not shown), no reduction in risk for smoking-related cancers was observed. We examined this seeming inconsistency by using data from the “Diet and Cancer” study, a large prospective cohort study in Denmark including approximately 60 000 persons ( 34 ) . By evaluating the prevalence of smoking in five income categories, we found a clear inverse linear trend among men, but not among women. Among men, the smoking prevalence was 57.1% in the lowest and 30.7% in the highest income categories in 1985. Among women, the prevalences of smoking were similar in the four lowest income categories (∼33%), and it was 24.9% in the highest income category, which included only 1.8% of all women. Thus, smoking prevalence may be inversely related to the socioeconomic status of men but not of women.
The increased standardized incidence ratio for cervical cancer among cellular telephone users in our study is difficult to interpret. The major risk factor for this disease is infection with human papillomavirus, which in turn is strongly influenced by the number of sexual partners ( 35 ) . We also note that cellular telephone subscribers had a higher average income than the general population and cervical cancer risk is inversely associated with educational level ( 36 ) . Other than chance, these observations point to the possibility that women who subscribed to cellular telephone service in the early years differed from the general population in terms of sexual activity. We also have no explanation for the greater than expected incidence of kidney cancer among women. Thus, because no such increase was found among men, the increased standardized incidence ratio among women is likely the role of chance, due to the many statistical comparisons made in this analysis.
The study has several strengths. Because of the nationwide coverage, the large size of the cohort, and the long follow-up period, we were able to address potential risks many years after first telephone use that has not been possible in most studies conducted to date. To our knowledge, this is the only cohort study addressing cellular telephone use and cancer risk and as such is not susceptible to biases found in case–control studies, e.g., such as those due to differential survival, recall, reporting, and participation ( 37 ) . Another strength is the use of objective measures of exposure, namely the years of subscription, derived from the files of all Danish network providers. A further strength of our study was the elimination of exposed cohort members, i.e., cellular telephone subscribers, from the comparison population in the calculation of the standardized incidence ratios, removing a potential source of underestimating an association. We also were able to obtain additional data on income, smoking, and self-reported cellular telephone use to assist us in interpreting our findings.
The study also has limitations. One limitation is the exclusion of users whose subscription was in the name of their company, which might not only have reduced the proportion of users but also excluded some of the most active users. We also had no information on new subscribers after 1995, and they were therefore all included in the reference population. This means that the majority of our reference population consists of recent cellular telephone users, which is a potential source of underestimation of risk. However, overall epidemiologic evidence suggests no cancer association with short-term use of cellular telephones; hence, this is unlikely to have substantially influenced our results. Another limitation is that the use of subscription information raises the possibility of some exposure misclassification. Users of cellular telephones whose subscriptions are not listed in their names were classified as unexposed in this study, i.e., they were included in the general population rates used to compute expected values, and subscribers who did not actually use a cellular telephone were classified as exposed. Misclassification from using subscriber data is nondifferential, i.e., the expected direction of any bias is toward the null.
We evaluated the potential for bias by comparing our subscriber list with self-reported information from 822 Danes who participated as control subjects in a case–control study (Interphone) of the possible association between brain tumor risk and use of cellular telephones ( 12 , 14 ) . More than 60% of our Interphone control subjects who were identified within the subscriber cohort characterized themselves as making or receiving calls at least once a week, although the comparison population of nonsubscribers included only 16% of such users. The disagreement between the methods, however, does not reflect only misclassification based on subscription data, as self-reported cellular telephone use is far from established as the gold standard for exposure estimation, although it has been used in almost all the case–control studies in this research area ( 4 , 5 , 7 – 10 , 12 – 22 ) . Recent validation studies have in fact shown marked discordance in comparisons of self-reported use of cellular telephones with usage records from network providers ( 38 – 40 ) .
Thus, both exposure assessment methods, i.e., subscriber information and self-reported usage, have certain advantages and disadvantages, and both introduce bias from exposure misclassification into the relative risk estimation. In addition, the valid estimation of cellular telephone use must serve as a proxy for exposure to radio frequency electromagnetic fields from these devices ( 41 , 42) . It is thus reassuring that the findings from our cohort study are consistent with most case–control studies conducted worldwide even though different approaches for exposure assessment were used.
In conclusion, we found no increased risk of brain tumors, acoustic neuromas, salivary gland tumors, eye tumors, leukemias, or overall cancer in this large, nationwide cohort study of cellular telephone subscribers in Denmark. There was also no increased risk of brain tumors and leukemias observed among the 56 648 persons whose subscription to cellular telephone service was greater than 10 years. Moreover, the narrow confidence intervals provide evidence that any large association of risk of cancer and cellular telephone use can be excluded. Despite uncertainties in estimating actual telephone use, the consistency of the findings with case–control studies conducted in Denmark and in other parts of the world is reassuring. The methods used suggest that the use of cellular telephones does not pose a substantial risk of brain tumors among short-term or long-term users, but for the latter group, further follow-up is required. Because there are so few, if any, nationwide cohort studies of cellular telephone use, continued follow-up of this study is planned, coupled with improved methods of assessing telephone use.
This research was supported by the Danish Strategic Research Council (2064-04-0010) and the Danish Cancer Society. The funding sources were not involved in the study design or data collection, analyses, or interpretation. All authors had final responsibility for the writing of the manuscript and the decision to submit for publication.
References
Sienkiewicz ZJ, Kowalczuk CI. A summary of recent reports on cellular phones and health (2000–2004). Chilton (U.K.): National Radiological Protection Board, NRPB-W65; 2005. Available at: http://www.hpa.org.uk/radiation/publications/w_series_reports/2005/nrpb_w65.pdf . [Last accessed: October 21, 2006.]
Dimbylow PJ, Mann SM. SAR calculations in an anatomically realistic model of the head for mobile communication transceivers at 900 MHz and 1.8 GHz.
Rothman KJ, Chou CK, Morgan R, Balzano Q, Guy AW, Funch DP, et al. Assessment of cellular telephone and other radio frequency exposure for epidemiologic research.
Hardell L, Nasman A, Pahlson A, Hallquist A, Hansson Mild K. Use of cellular telephones and the risk for brain tumors: a case-control study.
Muscat JE, Malkin MG, Thompson S, Shore RE, Stellman SD, McRee D, et al. Handheld cellular telephone use and risk of brain cancer.
Dreyer NA, Loughlin JE, Rothman KJ. Cause-specific mortality in cellular telephone users.
Inskip PD, Tarone RE, Hatch EE, Wilcosky TC, Shapiro WR, Selker RG, et al. Cellular-telephone use and brain tumors.
Johansen C, Boice JD Jr, McLaughlin JK, Olsen JH. Cellular telephones and cancer—a nationwide cohort study in Denmark.
Muscat JE, Malkin MG, Shore RE, Thompson S, Neugut AI, Stellman SD, et al. Handheld cellular telephones and risk of acoustic neuroma.
Hardell L, Hallquist A, Hansson Mild K, Carlberg M, Pahlson A, Lilja A. Cellular and cordless telephones and the risk for brain tumors.
Auvinen A, Hietanen M, Luukkonen R, Koskela RS. Brain tumors and salivary gland cancers among cellular telephone users.
Christensen HC, Schüz J, Kosteljanetz M, Poulsen HS, Thomsen J, Johansen C. Cellular telephone use and risk of acoustic neuroma.
Lönn S, Ahlbom A, Hall P, Feychting M. Mobile phone use and the risk of acoustic neuroma.
Christensen HC, Schüz J, Kosteljanetz M, Poulsen HS, Boice JD Jr, McLaughlin JK, et al. Cellular telephones and risk for brain tumors: a population-based, incident case-control study.
Lönn S, Ahlbom A, Hall P, Feychting M. Long-term cellular phone use and brain tumor risk.
Hardell L, Carlberg M, Hansson Mild K. Pooled analysis of two case-control studies on the use of cellular and cordless telephones and the risk of benign brain tumours diagnosed during 1997–2003.
Hardell L, Carlberg M, Hansson Mild K. Pooled analysis of two case-control studies on use of cellular and cordless telephones and the risk for malignant brain tumours diagnosed in 1997–2003.
Schoemaker MJ, Swerdlow AJ, Ahlbom A, Auvinen A, Blaasaas KG, Cardis E, et al. Mobile phone use and risk of acoustic neuroma: results of the interphone case-control study in five North European countries.
Hepworth SJ, Schoemaker MJ, Muir KR, Swerdlow AJ, van Tongeren MJ, McKinney PA. Mobile phone use and risk of glioma in adults: case-control study.
Schüz J, Böhler E, Berg G, Schlehofer B, Hettinger I, Schlaefer K, et al. Cellular phones, cordless phones, and the risk of glioma and meningioma (Interphone Study Group, Germany).
Hardell L, Hallquist A, Hansson Mild K, Carlberg M, Gertzen H, Schildt EB, et al. No association between the use of cellular or cordless telephones and salivary gland tumors.
Stang A, Anastassiou G, Ahrens W, Bromen K, Bornfeld N, Jöckel KH. The possible role of radiofrequency radiation in the development of uveal melanoma.
Johansen C, Boice JD Jr, McLaughlin JK, Christensen HC, Olsen JH. Mobile phones and malignant melanoma of the eye.
Ahlbom A, Green A, Kheifets L, Savitz D, Swerdlow A; ICNIRP (International Commission for Non-Ionizing Radiation Protection) Standing Committee on Epidemiology. Epidemiology of health effects of radiofrequency exposure.
Storm HH, Michelsen EV, Clemmensen IH, Pihl J. The Danish Cancer Registry—history, content, quality and use.
National Board of Health. Cancer incidence in Denmark 1996; health statistics 1999. No. 3. Copenhagen (Denmark): Danish National Board of Health;
World Health Organization. International Classification of Diseases for Oncology (ICD-O). Geneva (Switzerland): WHO;
Olsen JH, Friis S, Frederiksen K, McLaughlin JK, Mellemkjaer L, Moller H. Atypical cancer pattern in patients with Parkinson's disease.
Breslow NE, Day NE. Statistical methods in cancer research: volume II—the design and analysis of cohort studies. IARC Scientific Publications No. 82. Lyon (France): IARC Press;
Bailar JC, Ederer F. Significance factors for the ratio of a Poisson variable to its expectation.
Cardis E, Kilkenny M. International case-control study of adult brain, head and neck tumors: results of the feasibility study.
Lahkola A, Salminen T, Auvinen A. Selection bias due to differential participation in a case-control study of cellular phone use and brain tumors.
Chakrabarti I, Cockburn M, Cozen W, Wang YP, Preston-Martin S. A population-based description of glioblastoma multiforme in Los Angeles County, 1974–1999.
Bak H, Christensen J, Thomsen BL, Tjonneland A, Overvad K, Loft S, et al. Physical activity and risk for lung cancer in a Danish cohort.
Kjaer SK, van den Brule AJ, Bock JE, Poll PA, Engholm G, Sherman ME, et al. Human papillomavirus—the most significant risk determinant of cervical intraepithelial neoplasia.
Braaten T, Weiderpass E, Kumle M, Lund E. Explaining the socioeconomic variation in cancer risk in the Norwegian women and cancer study.
Vrijheid M, Deltour I, Krewski D, Sanchez M, Cardis E. The effects of recall and non-response bias in epidemiologic studies of the potential cancer risk of mobile phones.
Parslow RC, Hepworth SJ, McKinney PA. Recall of past use of mobile phone handsets.
Samkange-Zeeb F, Berg G, Blettner M. Validation of self-reported cellular phone use.
Vrijheid M, Cardis E, Armstrong BK, Auvinen A, Berg G, Blaasaas KG, et al. Validation of short-term recall of mobile phone use for the interphone study.
Berg G, Schüz J, Samkange-Zeeb F, Blettner M. Assessment of radiofrequency exposure from cellular telephone daily use in an epidemiological study: German validation study of the international case-control study of cancers of the brain—INTERPHONE Study.

